Product Updates | November 19th
This release brings a new way to see what changed across your book of business, real experiments with control groups in playbooks, Slack conversations next to your emails, and a fresh look for filters, segments, and dashboard widgets, with a more intuitive way to build conditions and filters across the whole app. Below is an overview of the new features and improvements included in this release.
Release Spotlight
'What Changed' and Health Drops in MyCustify
You already rely on Custify to flag accounts that need action. Two new MyCustify sections add the view in between: what changed across your whole book since last week, last month, or last quarter, and which health scores dropped, without opening a single customer profile.
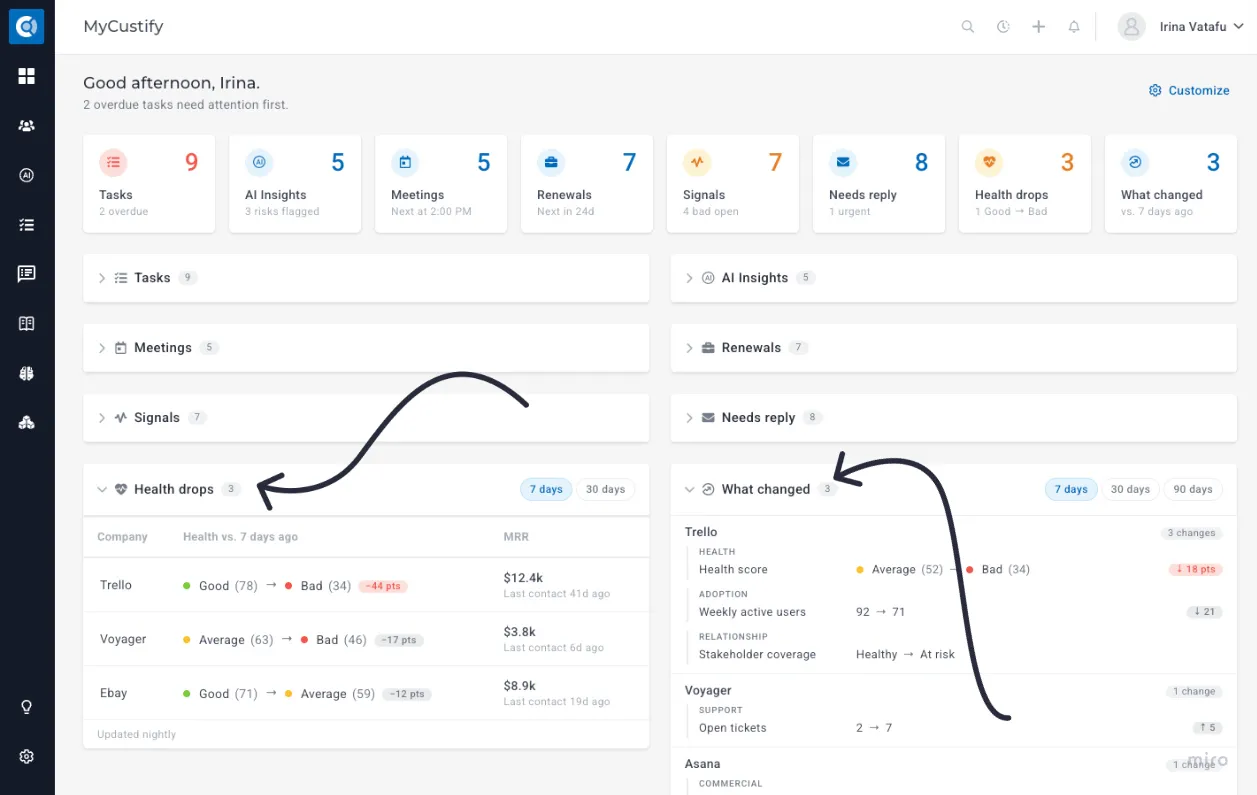
What Changed section shows, for every company in your book, the data points your team chose to track that changed over the last 7, 30, or 90 days (written as 'before → now'). Each company gets its own block listing only what changed, for example:
- Health score: Good (85) → Average (72)
- Open tickets: 2 → 7
- Stakeholder coverage: Healthy → At Risk
Companies with the most changes come first, and hovering over a line explains it in plain words ("Open tickets went from 2 to 7 since Oct 20").
Health drops lists the companies whose global health score moved to a worse band compared with 7 or 30 days ago (Good → Needs attention, Good → Bad, Needs attention → Bad). It shows the drops that stuck, not the daily ups and downs, with the points lost, the company’s MRR, and the last contact, with the worst drops first.
How to use it:
Health drops works out of the box for accounts with a Global Health score populated; it is refreshed every night and appears at the end of your MyCustify layout.
For What changed, an admin chooses what to track in Settings - App settings - MyCustify: add headings (for example, Adoption, Support, Commercial) and the attributes, calculated metrics, and health scores under each, up to 50. For numbers, set a minimum change (for example, 10%) so small moves don’t show; values that change constantly, such as counters or "days until" values, appear for almost every company otherwise. The section fills a few minutes after the first save, then refreshes nightly. Use the 7 / 30 / 90 days switch in the section header to change the window.
Good to know: both sections compare the start of the window with today, so a value that changed and changed back in between is not listed. Churned companies are left out.
For more details, see MyCustifyMyCustify.
Slack Conversations and Smarter Slack Messages
Many customer relationships live in shared Slack channels, where only the people in the channel can see them. This release brings Slack much closer to Custify:
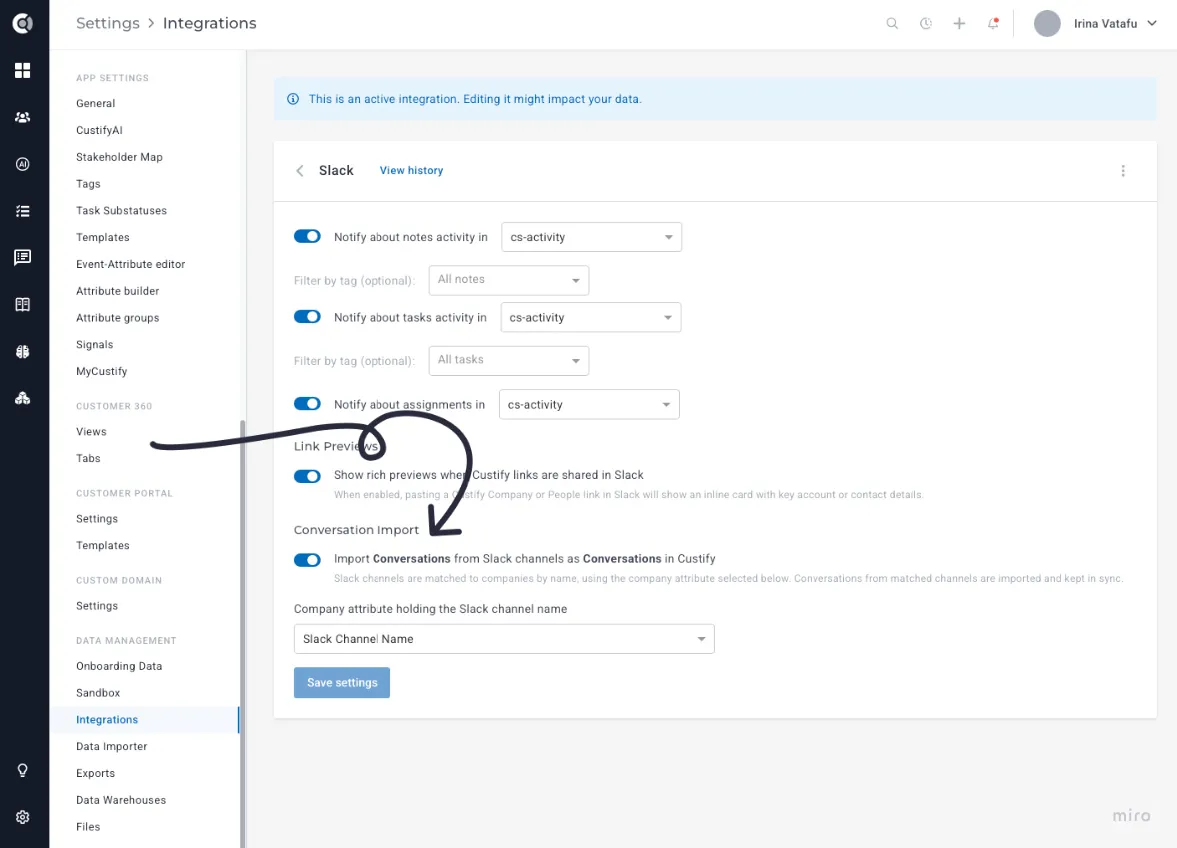
- Slack conversations in Custify: messages from a company’s Slack channel now appear next to your emails, in the Communication tab, on the Customer 360 and in MyCustify. Each thread is its own conversation, and Slack is available in the Source filter. The last 90 days are imported when you turn it on, and new messages arrive within seconds.
How to use it: go to Integrations - Slack, turn on Conversation Import, and make sure the Slack channel attribute is filled in for each company with the name of its channel. For private and Slack Connect channels, invite the Custify app first.
Slack messages to the account owner: a playbook Slack message can go privately to whoever is the CSM or Account Manager of each company, so one playbook alerts the right owner for every account. For that, Custify users should connect first their Slack accounts to Custify by going to Settings - Profile Settings - My Account - Slack - Connect.
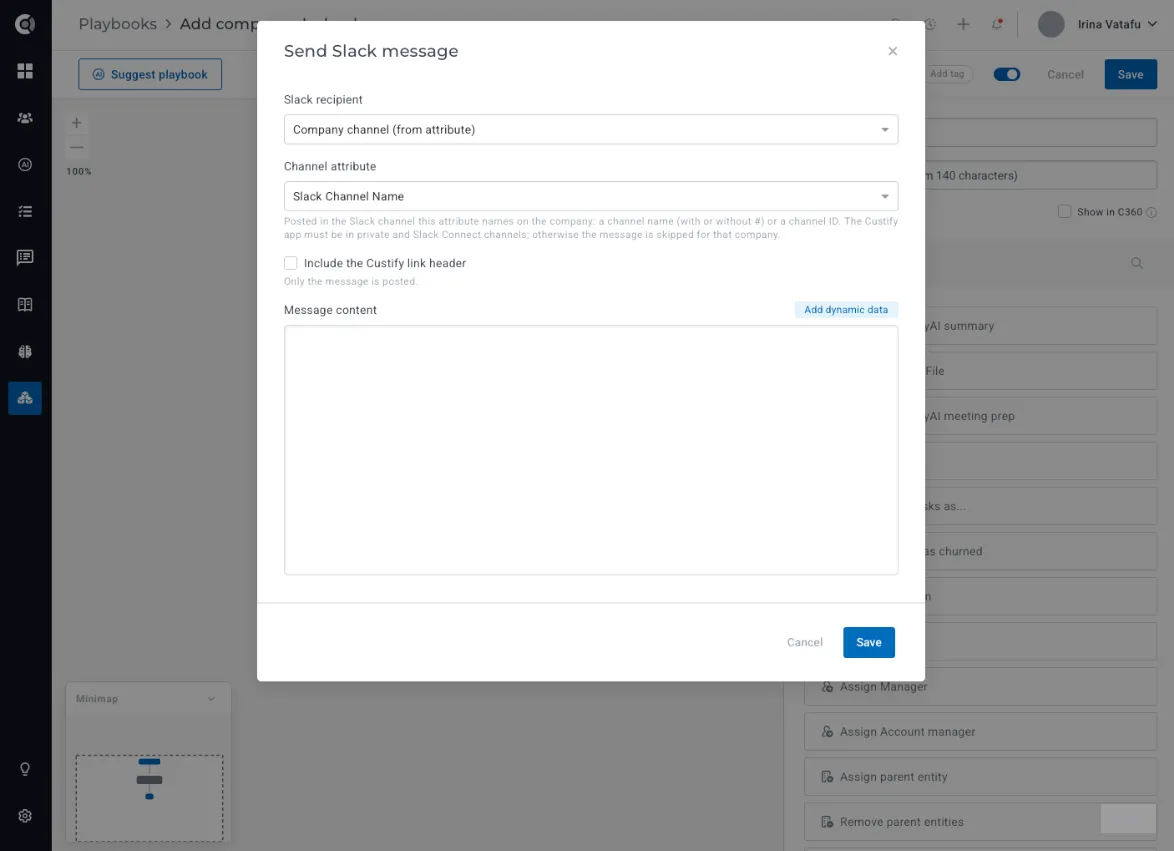
Slack messages to each customer’s channel: choose the new Company channel (from attribute) as recipient in the Send Slack message step, and playbooks post your updates in each customer’s own channel, with dynamic data filled in.
For more details, see the SlackSlack article.
A/B Testing in Playbooks
Is the CSM call working better than the email sequence? Is either of them better than doing nothing? Until now, playbooks were built based on gut feeling. The Multi-branch step can now split companies at random and measure the result, so you can prove which play actually moves the needle.
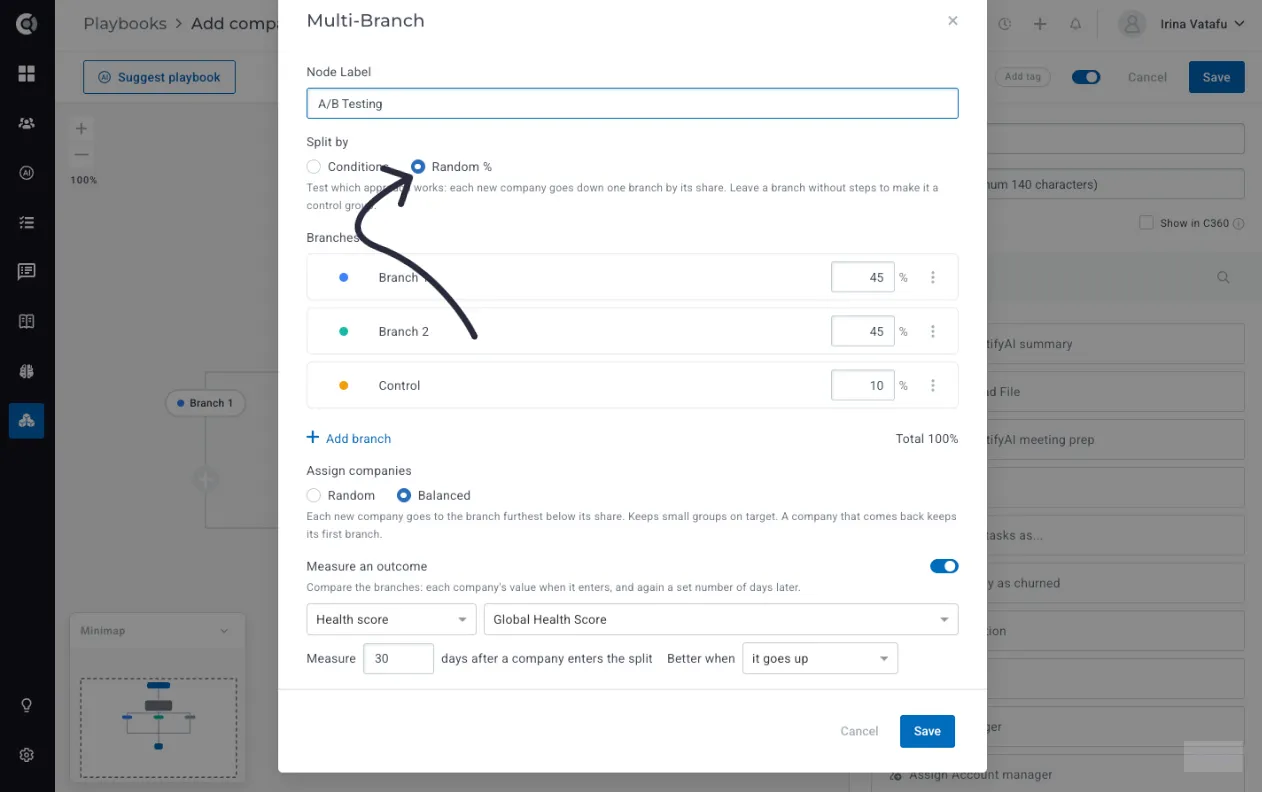
Choose Split by: Random % on a Multi-branch step and give each branch a share instead of a condition, for example, A 45%, B 45%, Control 10%. A branch with no steps acts as a control group: those companies simply continue past the split. Then pick the outcome you care about (a health score, a numeric attribute, a calculated metric, being in a segment, or churn) and when to measure it, for example, 30 days after entry.
The step’s details panel then shows a results table per branch: how many entities were assigned, how many have been measured, the average at entry and at the end of the window, and the share that improved. Click any row to open the matching companies.
- Random assignment (default) is ideal for larger volumes; Balanced keeps groups on target even with a few dozen companies.
- A company that enters the playbook again always keeps the branch it got the first time, so your groups stay clean.
- Shares must add up to 100%, with at least 2 branches. A hint tells you when a branch has fewer than 30 measured entities, which is too few to conclude.
How to use it: open a company or people playbook, add or edit a Multi-branch step, and switch Split by to Random %. Set the outcome before you start, so values at entry are captured from the very first company. To end a test, switch back to Conditions and keep the winning branch.
For more details, see PlaybooksPlaybooks.
Playbooks That Start When the Meeting Ends
The moment a call ends is when the next steps are clearest, and also when they are easiest to forget. With the new Meeting Summarized start trigger, a playbook starts as soon as your note taker delivers the summary of a meeting. Surveys, tasks, and internal updates go out on their own, and nobody has to remember them.
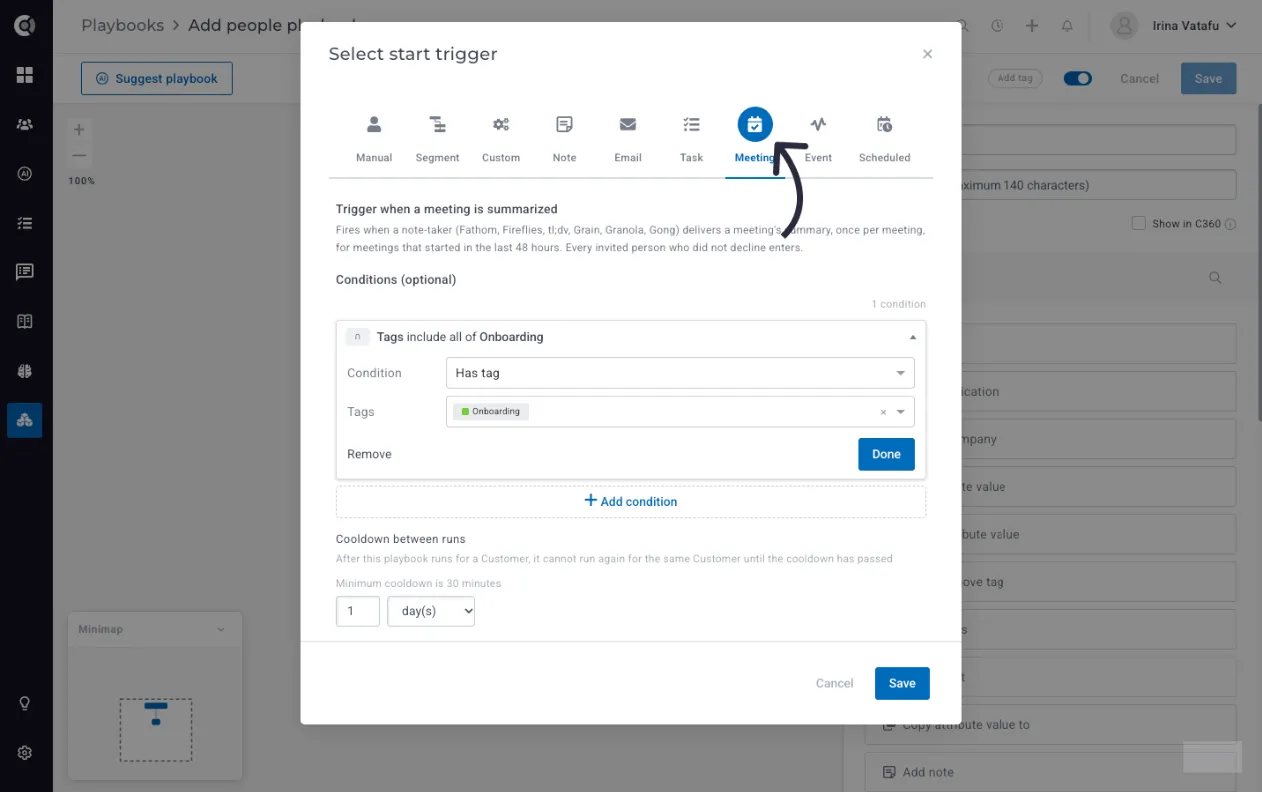
The trigger works with Fathom, Fireflies, tl;dv, Grain, Granola, and Gong. The companies in the meeting enter a company playbook, or the participants enter a people playbook. The meeting title, date, summary, and recording link are available as dynamic data in your emails, surveys and tasks.
A few ways to use it:
- Ask for feedback while the call is fresh. Send a CSAT or NPS survey to everyone who joined.
- Hand the CSM a ready task. Create a follow-up task for the CSM to never miss the next steps.
- Keep the wider team informed. Send an internal alert to the account owner or CS lead.
- Track meeting coverage. Update a “Last meeting date” attribute on the company, so your segments and health scores can flag accounts that have gone too long without a call.
How to use it: connect your note taker in Integrations, then create a playbook and choose Meeting summarized as the start trigger. When several companies take part in one meeting, each of them enters the playbook on its own.
A Fresh Look for Filters and Conditions
Redesigned List Filters
Every filter on the Companies and People lists now explains itself. A sentence at the top spells out exactly what the filter matches as you build it, for example, "Matches companies whose Name ends with "acme"", so anyone can read a saved view without guessing.
Conditions in named groups: one dropdown, already open when you add a filter, with conditions grouped (Exact match, Partial match, and so on) and a small symbol for each. Date conditions are searchable.
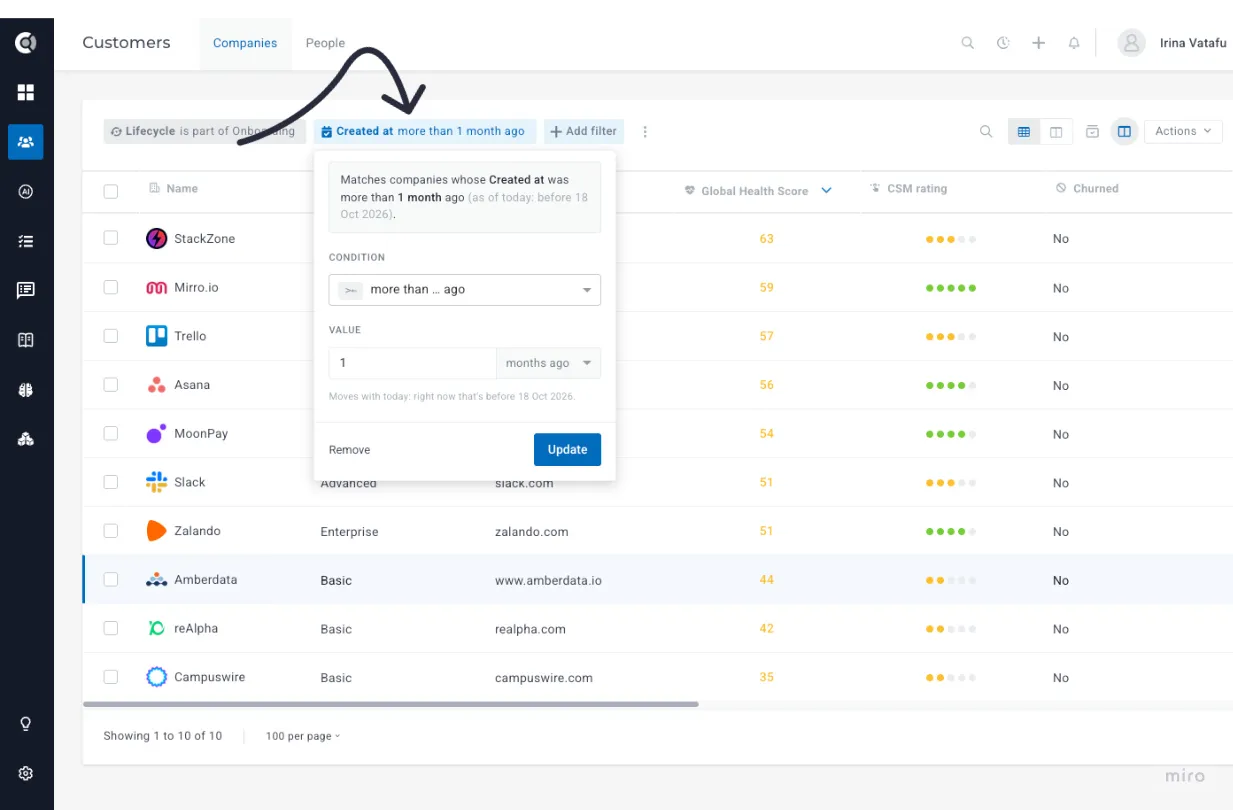
- Days, weeks, or months: relative dates now take weeks and months too, for example, "Signed up less than 2 weeks ago". They are recalculated every time the list loads.
- Your week: "this week" and "last week" now follow your account’s first day of the week, set in Settings > General. This also applies to Tasks, the Customer Portal, Customer 360 tabs, the MCP server, and the API.
- Real calendars interface for specific dates, coloured tags, company logos when you search for a company, and "Me" first when you pick a user.
Your saved views and filter links keep working exactly as before. A filter in weeks is converted to days when you save it as a segment; filters in months can’t be saved as a segment yet.
Filter Panels That Show What Is Applied
When a number looks off, the first question is always "which filters are behind this list?" The filter panel behind the funnel icon on Tasks, Notes, Meetings, Companies, People, Playbooks, Segments, and other lists now answers it at a glance.
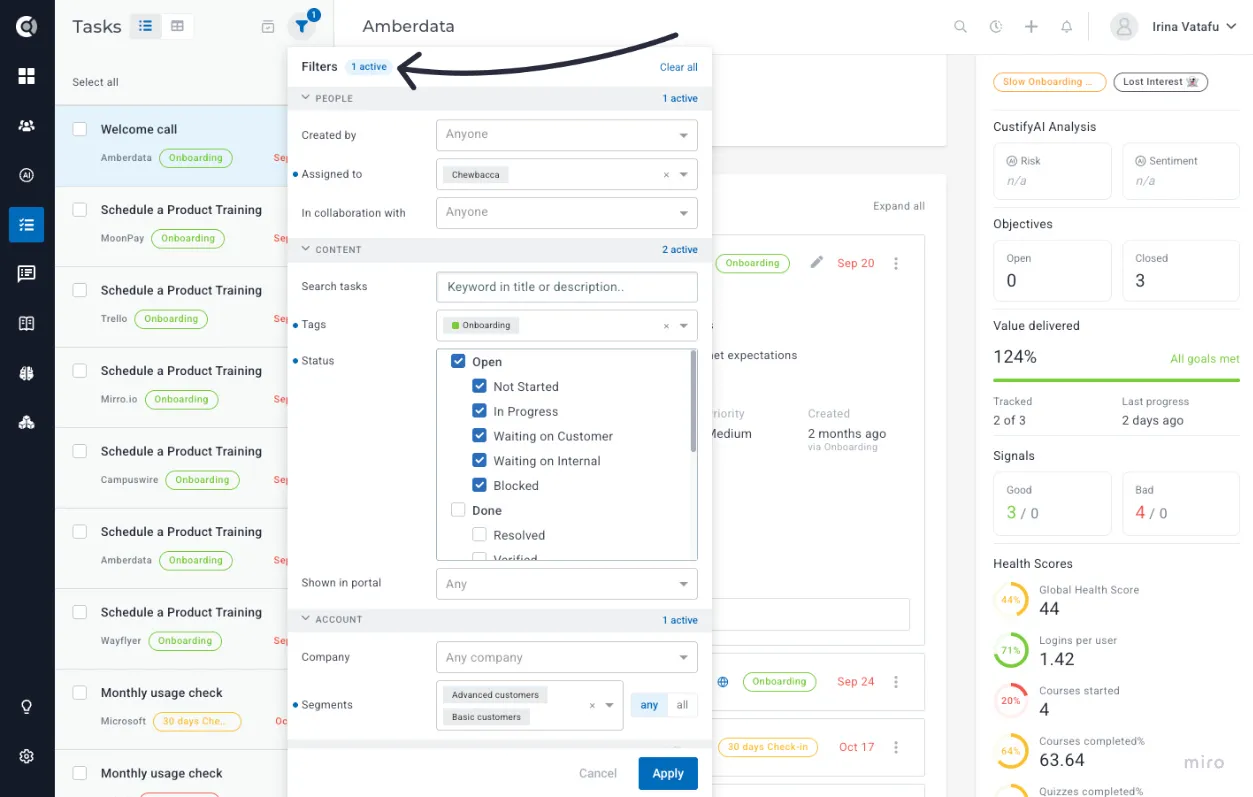
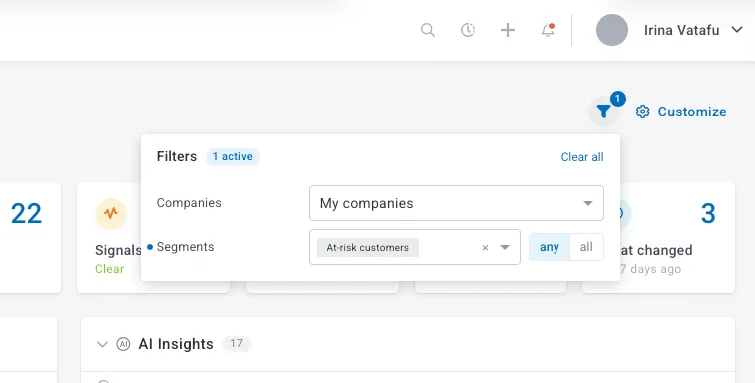
- A clear count: the panel is wider and titled "Filters · X active", showing exactly how many filters are applied, with a Clear all button that instantly removes all of them. The funnel icon shows the same number, even when the filter panel is not open.
- A dot per filter: every filter that holds a value is marked with a blue dot, and empty fields say what they would narrow ("Anyone", "Any tag", "Any time").
- Groups that fold: panels with more than 4 filters are grouped under People, Content, Account, and Dates. Fold a group, and it still tells you what it holds, for example "3 filters · 1 active".
- Segments any / all: a small toggle next to the Segments field that allows you to select the relationship between the selected segments; now also available on Notes, Meetings and Tasks.
On panels with an Apply button (Tasks, Inbox, Sent, and the Tasks and Communication tabs of a profile), nothing counts until you apply it: a new pick shows as a dot on its row, and Cancel or a click outside puts the panel back as it was. Panels without an Apply button, such as Notes, filter as you pick.
One Look for Every Condition
Conditions now look and work the same wherever you build them: in calculated metrics, playbook triggers, tag rules, and integration filters. Learn it once and use it everywhere, and read any rule a colleague set up at a glance.
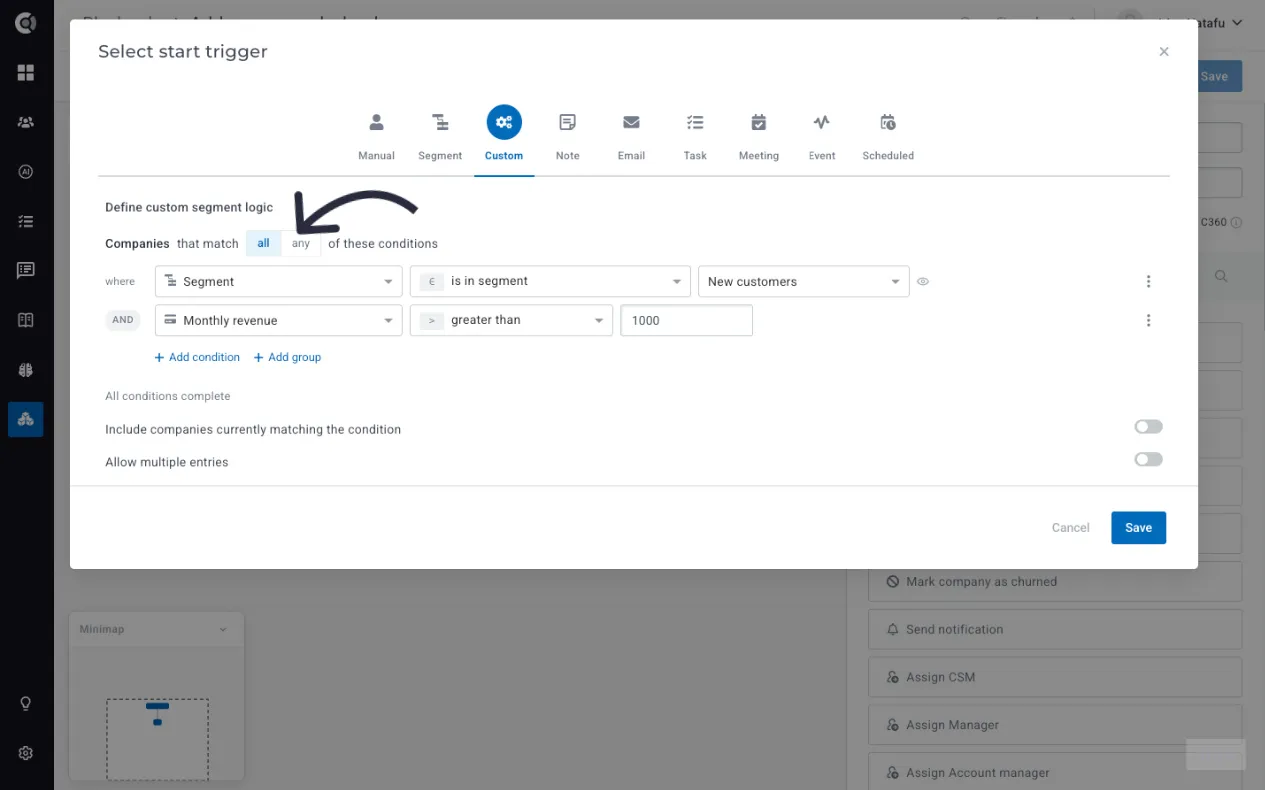
- Conditions that read as sentences: each condition is one line with a symbol, for example "seats greater than 10" or "Subject contains invoice → tag with Billing".
- One card open at a time: click a card to edit its Attribute, Condition, and Value, then click Done. A dashed Add filter row at the bottom adds the next one.
- All or any in one click: a counter shows how the conditions combine, for example, "2 conditions, all must match".
Good to know: your saved filters, rules, and conditions open exactly as they were, with the same results. In the HubSpot and Salesforce filtering, the Matching type field is now the all / any toggle. Segment.com allows up to 5 rules per event type, and tells you right away when a pattern is not a valid regular expression.
Redesigned Segment Editor
Segments drive your playbooks, lifecycles and dashboards, and building one is now quicker and easier to read. Your existing segments keep the same conditions and results; only the editor changed.
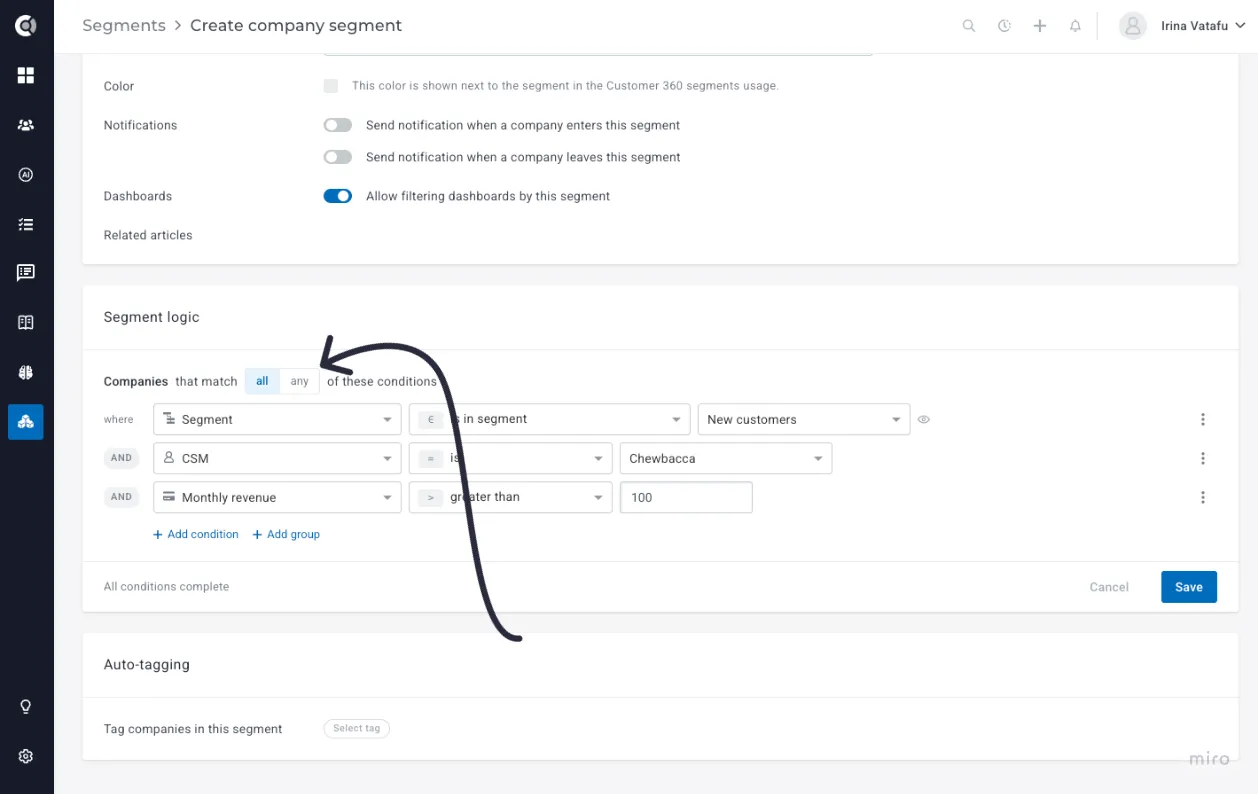
- One field picker: type to search across all fields, grouped just like + Add filter (Entities, Attributes, CustifyAI, Custom attributes, Metrics, Health scores, each integration, Signals and Events).
- Logic that reads top to bottom: "Companies that match all / any of these conditions", with an AND or OR chip on every row.
- Row menu: duplicate a condition, or move it into or out of a group, without rebuilding it.
- Paste a list: for "is in" and "is not in", paste one value per line and each becomes a chip.
- Save tells you what’s missing: "1 condition incomplete · Show" highlights every empty field.
The new editor is used for company and people segments, custom start and exit triggers in playbooks, and lifecycle stage and goal criteria.
Customer List and Views
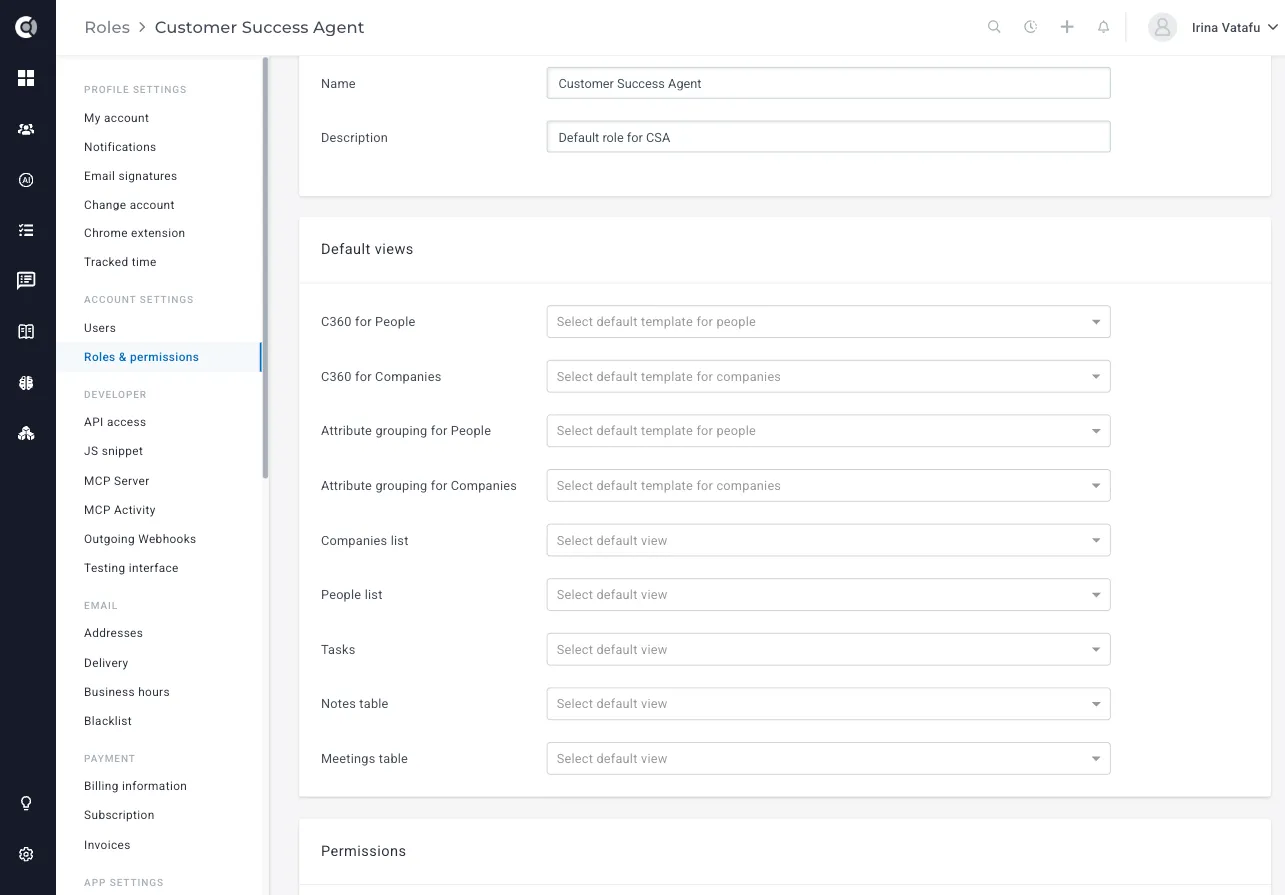
Default views per role
Help every user start from the right fields and filters. Admins can now choose the view each role opens first on the Companies, People, Tasks, Notes and Meetings lists, in Settings - Roles - Default views, and each user can set their own default view too. The Manage views window has been redesigned, with descriptions, sharing options, search, and a Private / Shared filter. Changes you make to a list in your browser, and shared links with filters, still take priority over the default view.
Filter Companies by Attribute Changes
“Which customers moved from Starter to Expert this quarter?” is a question Custify could already answer, but only after you built a segment for it. Now you can ask it directly in the Companies and People lists. A new Attribute changes section in Add filter finds the records where a value changed:
- Which attribute changed and when (this quarter, the last N days, between two dates, and more).
- Optionally, from and to which value, for example, plan changed from Starter to Expert.
- For numbers, by how much, as an amount or a percentage.
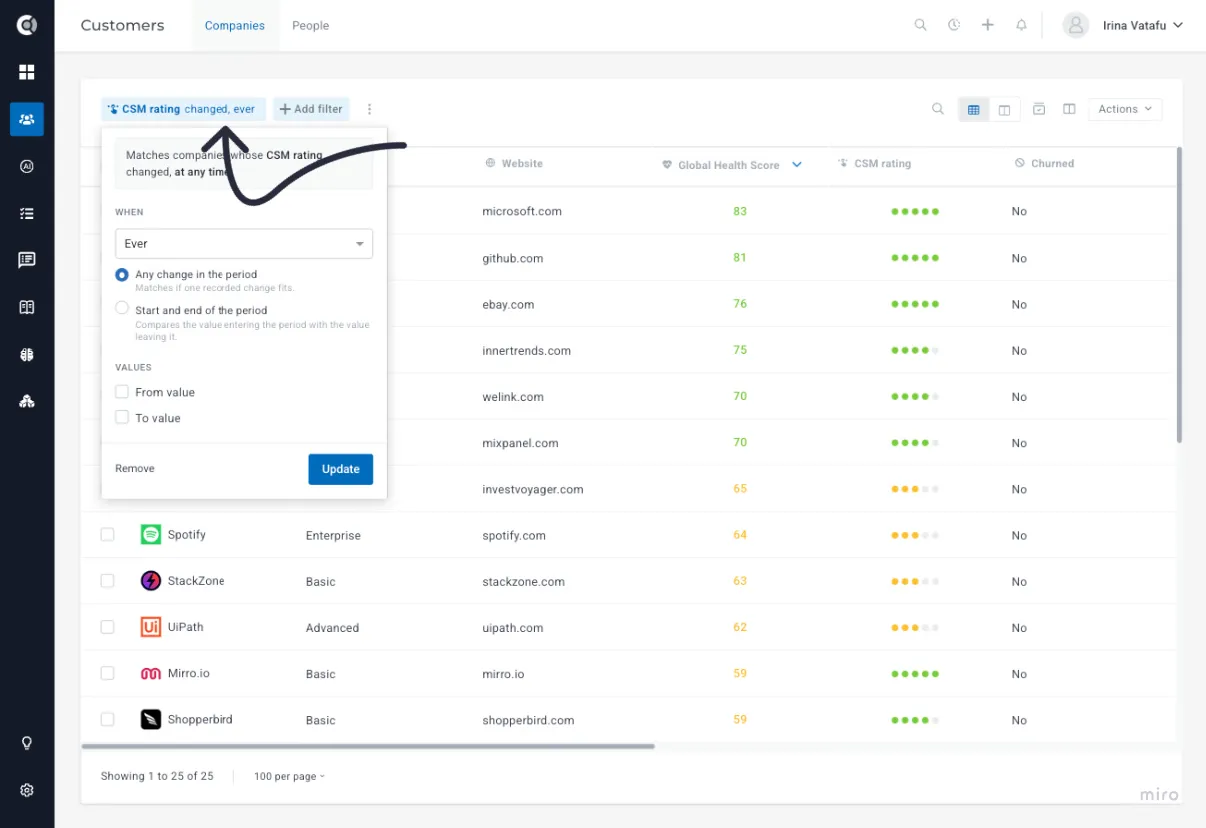
You can read a period in two ways. Any change in the period matches if at least one change fits. Start and end of the period compares the value at the start with the value at the end, which is usually what you want for upgrades and downgrades.
Because it is a regular filter, export, bulk actions, the board view and saved views all respect it. If the answer turns out to be worth keeping, you can still save it as a segment from the ⋮ menu.
How to use it: tracking is turned on per attribute. Go to Settings > Attributes and switch on Track changes for the attributes that matter (plan, tier, lifecycle stage, and so on). For health scores and calculated metrics, the same option is inside their editor. Custify fills in the history it already holds, so the filter is useful straight away.
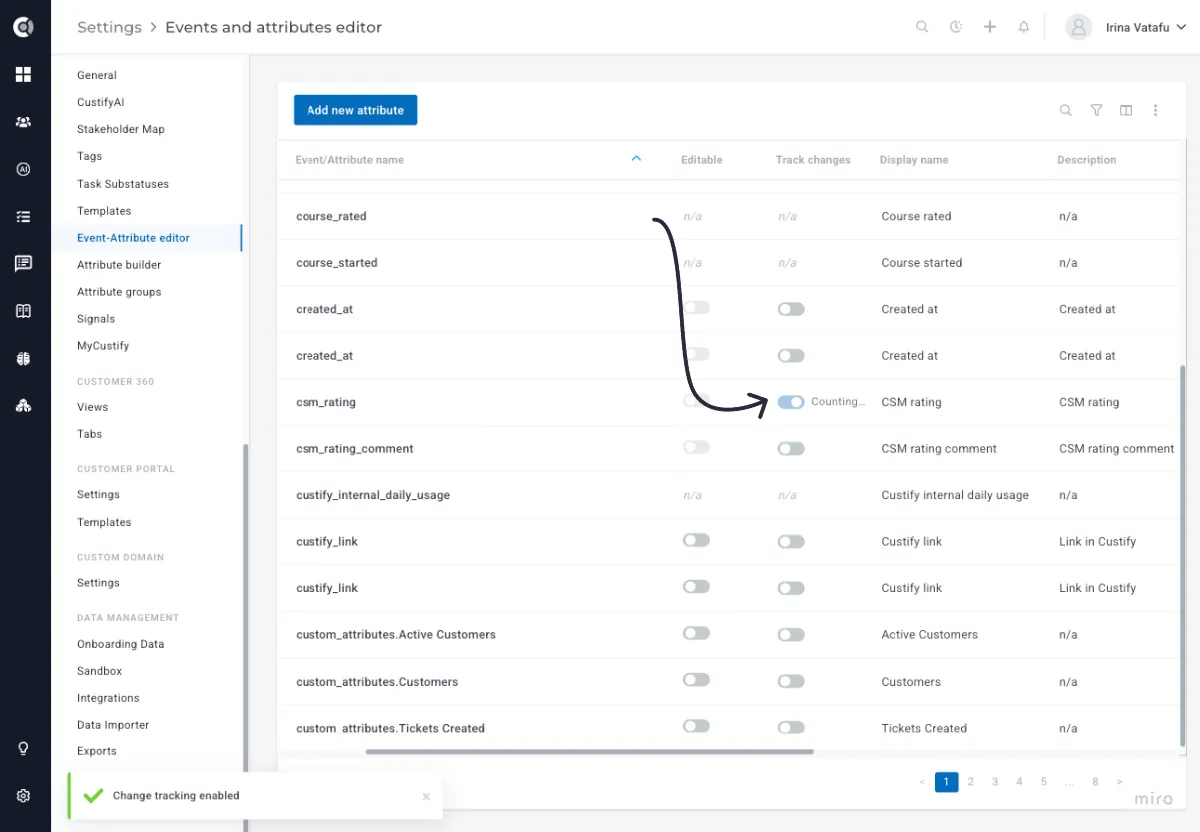
Good to know: health scores and calculated metrics are tracked per day; other attributes record the exact time of each change. Event attributes and deal attributes aren't covered yet, and you can't save a filter using “contains” as a segment.
Read more about it in the dedicated article Tracking Attribute ChangesTracking Attribute Changes.
Dashboards
New Widget Gallery
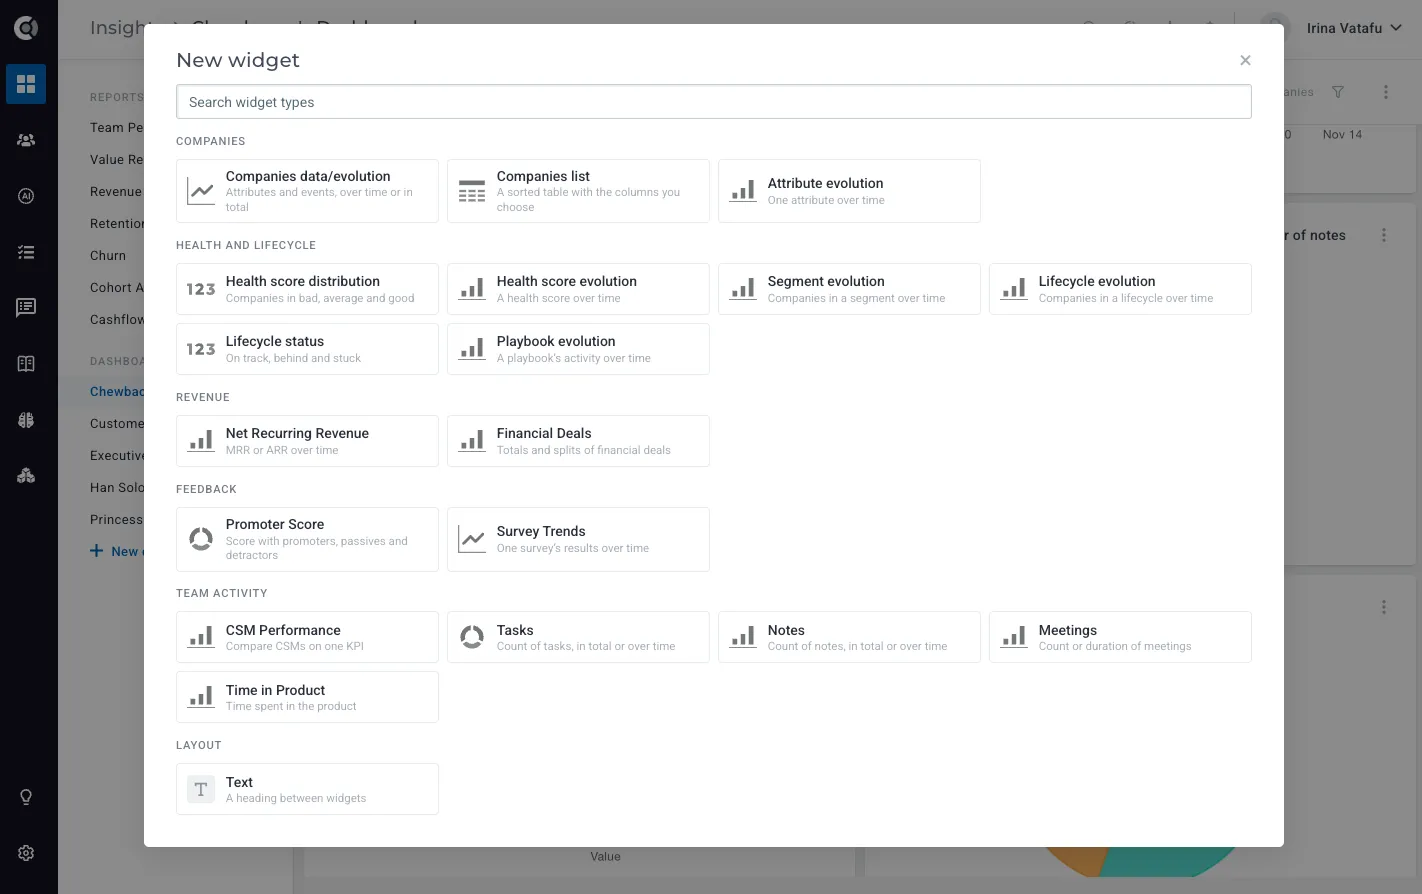
Adding a widget now starts from a gallery of every widget type, organized in six groups (Companies, Health and lifecycle, Revenue, Feedback, Team activity, Layout) with a search. The widget form puts the name and type on one line, splits longer forms into tabs, shows chart types as tiles, and marks every missing field at once when you save.
Filter Dashboards by Segment
Build a dashboard once and use it for every team, region, or tier. Every dashboard has a filter bar where viewers pick one or more segments and a timeframe, and every widget updates accordingly. The filter stays after a refresh, the link reproduces the same view for a colleague, and clicking on a widget (where clickable) opens the companies' list filtered the same way.
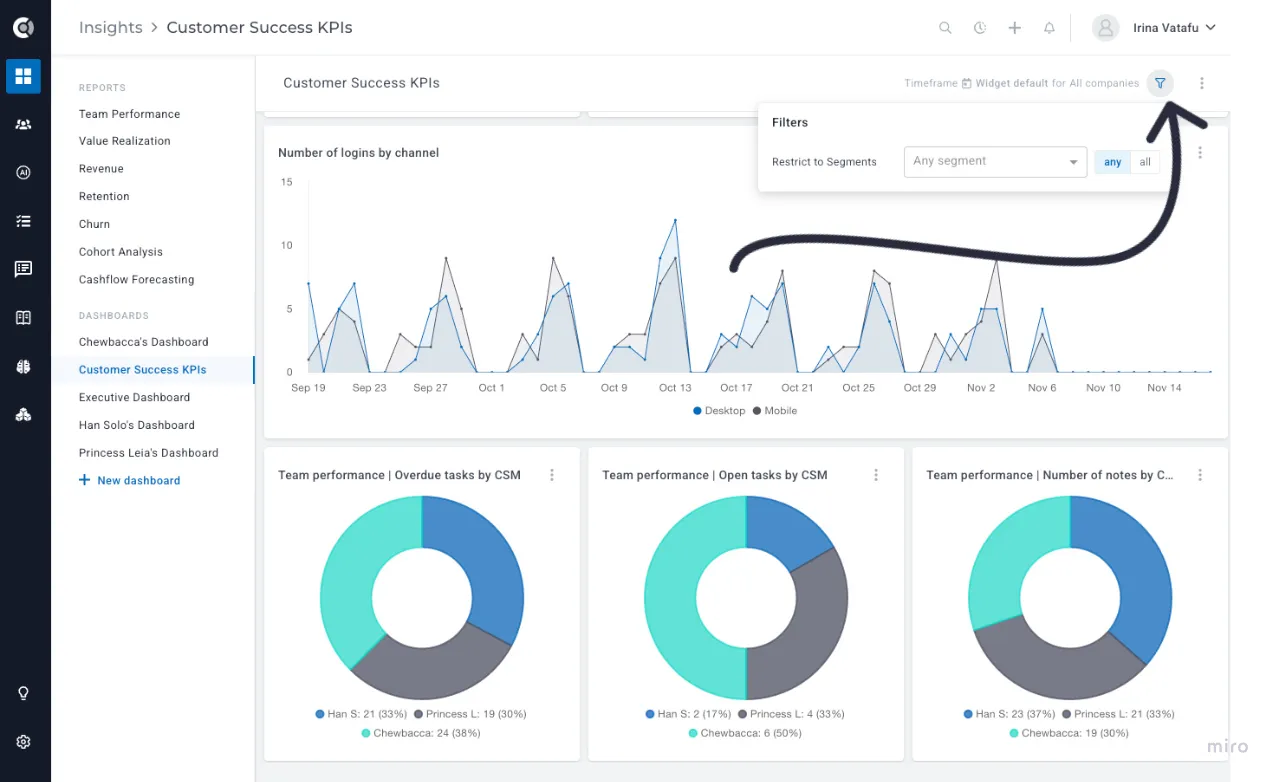
Dashboard owners can also organize the filters into groups, for example "CSM" and "Plan", so the filter bar shows one picker per group. Picks in the same group are combined with OR; picks across groups are combined with AND, so CSM = John + Anna and Plan = Enterprise shows Enterprise companies owned by either of them. Segments can get friendlier names, such as "Anna's customers", which are also used in PDF exports and scheduled emails.
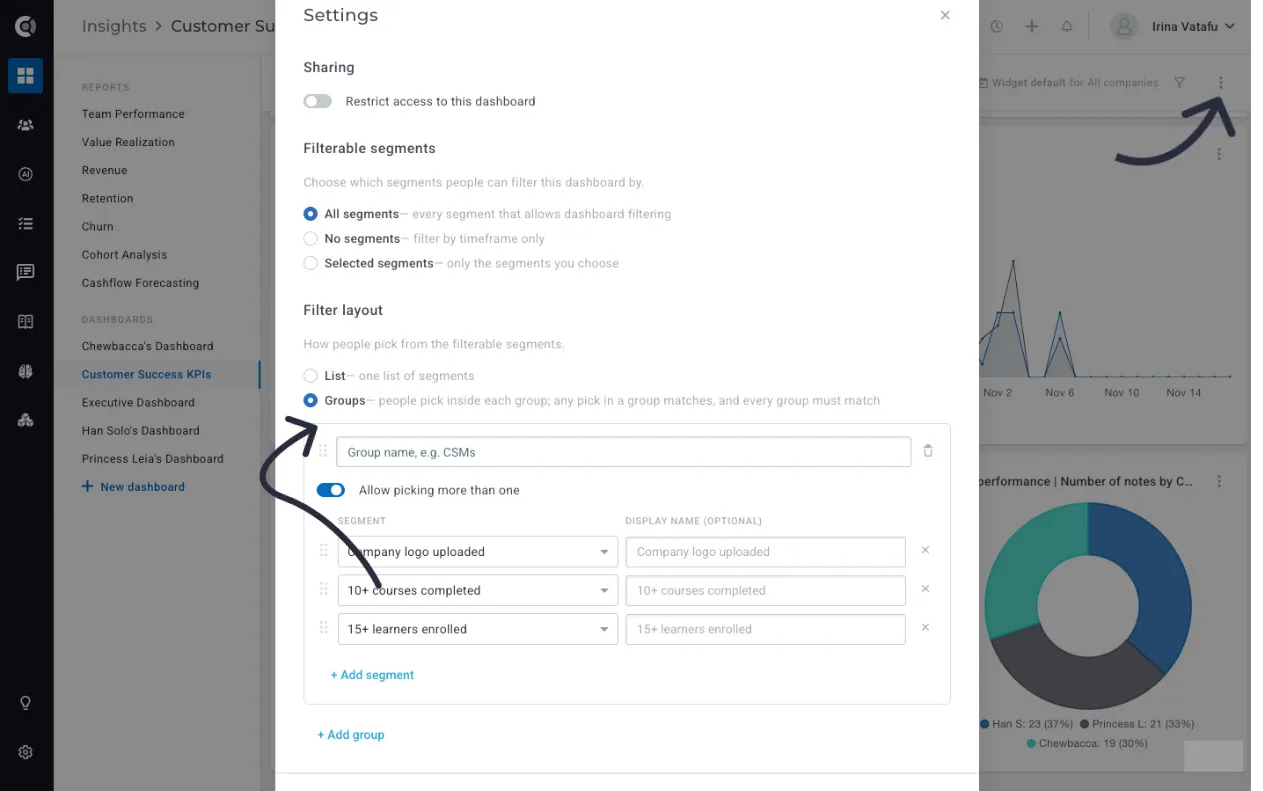
How to use it: open the dashboard menu, go to Settings > Filter layout, and choose Groups. The list layout stays available and works as before.
Custom Data Widget
Reporting on custom data used to mean creating a calculated metric for every question. The new Custom data widget turns your custom data rows into a number directly on the dashboard: count, sum, average, minimum, or maximum, with up to 5 filters. For example, the number of Campaigns where status is Active and the end date was less than 30 days ago, for a specific segment.
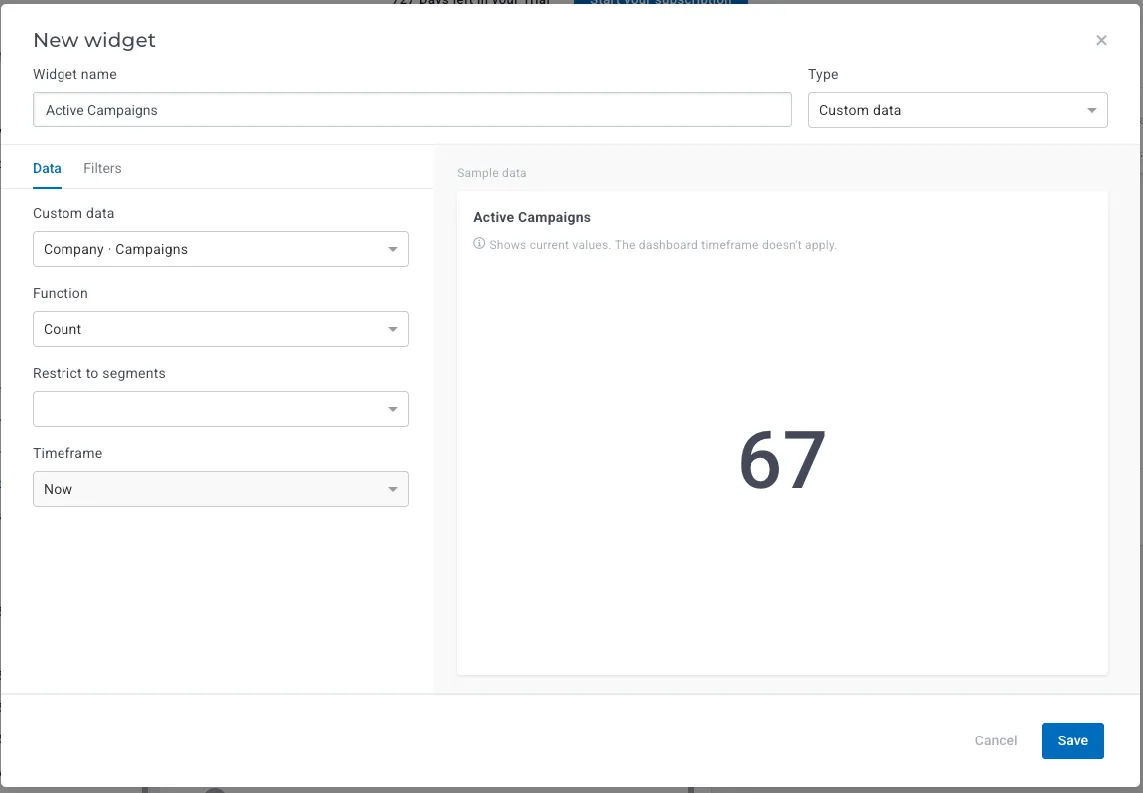
Filters read like the list filters; a warning appears if two filters can never match together, and the widget says "No rows match the filters" instead of showing a plain 0. Company and people data types are both available.
Good to know: custom data has no history, so this widget always shows the current value and the dashboard timeframe doesn’t apply. It is available for accounts that use custom data.
Several Event Fields on One Chart
Compare usage across products or features on a single chart. A Companies data/evolution widget can now plot up to 10 number fields of an event, each as its own line with its own name in the legend, using one function (sum, average, minimum or maximum) for all of them.
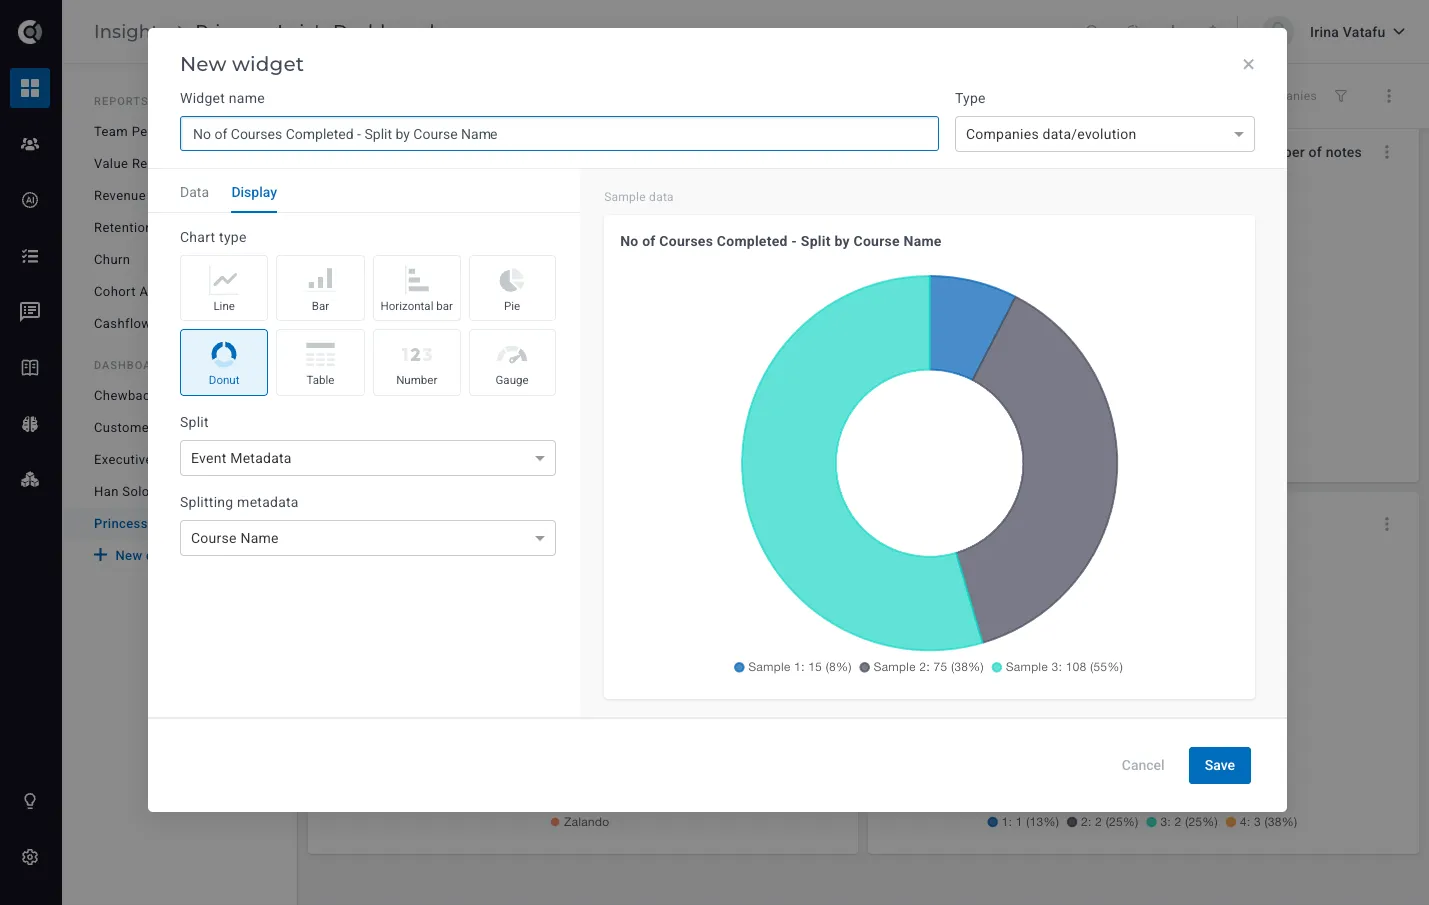
With two or more fields, the chart works as Line, Bar, Stacked bar, Horizontal bar, or Table, and the CSV export has one column per field.
Revenue and Renewals
MRR Movements per CSM
How much expansion did Anna’s accounts bring this quarter? The Team Performance report now shows the revenue behind each person’s book, not only their activity, so commission and bonus conversations no longer start with a spreadsheet.
For every CSM, Account Manager or other user field, you can now see the New, Expansion, Contraction and Churned MRR on the companies assigned to them, for any period you pick. Each amount shows how many companies are behind it; click it to see those companies with their revenue at the start and end of the period. Export the whole table, or a single person’s breakdown, to CSV.
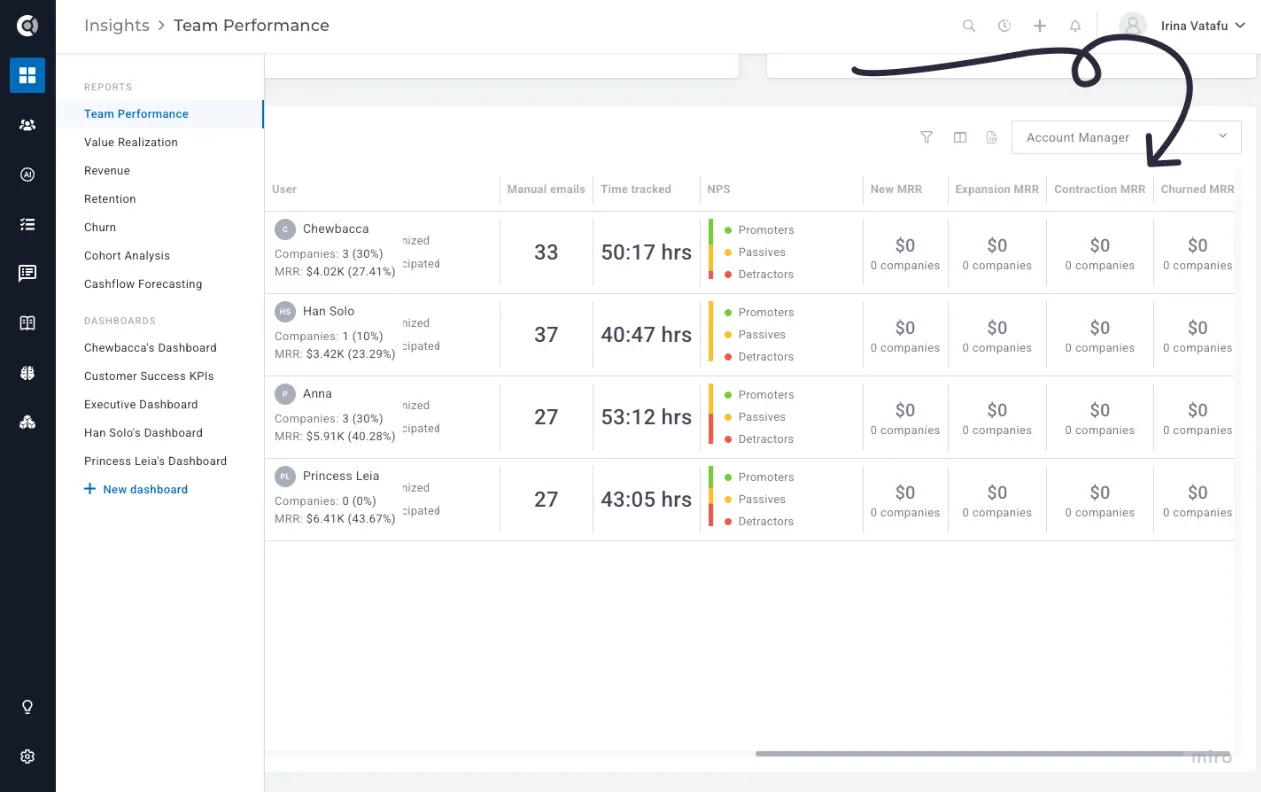
Credit is fair when accounts change hands: each MRR change goes to whoever owned the company at the start of that day, and past movements have already been filled in from your assignment history, so you can look back at previous quarters right away.
How to use it: go to Insights > Team Performance, pick the period and the user field, and tick the new revenue columns in the column picker. The columns and exports are visible to users who can see financial reports, and they follow your revenue type (accounts reporting in ARR see "Expansion ARR" and so on).
Expected Revenue in the Cashflow Forecast
If most of your customers pay monthly, a forecast that counts every future payment at full value looks the same every month. The cashflow forecast now has four views: Scheduled (every upcoming payment, as of today), Expected, Optimistic, and Pessimistic.
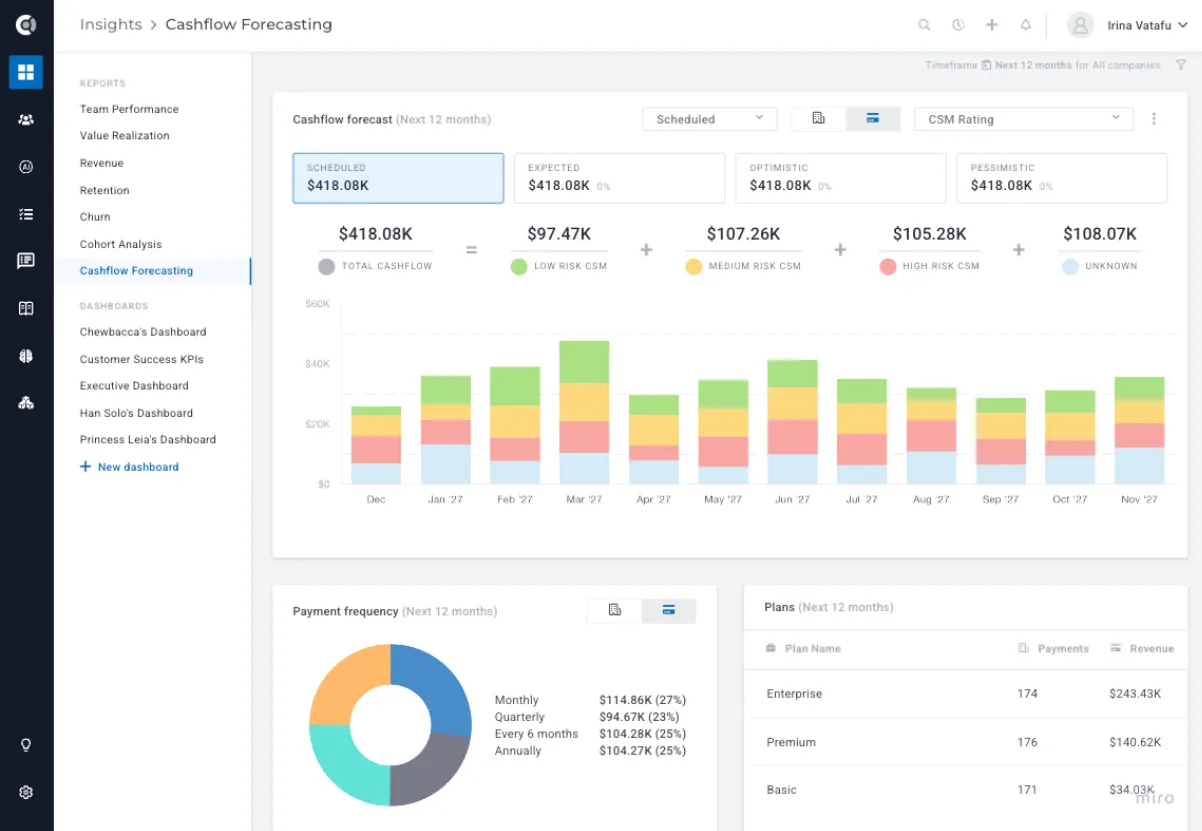
The Expected view discounts each future payment by a monthly churn rate based on the company’s risk, so the further ahead a payment is, the less it counts. Optimistic uses half the churn rates and Pessimistic one and a half times. A row of tiles shows the four totals side by side, and it works with every split: health score, CSM rating, CustifyAI risk score or your own risk attribute.
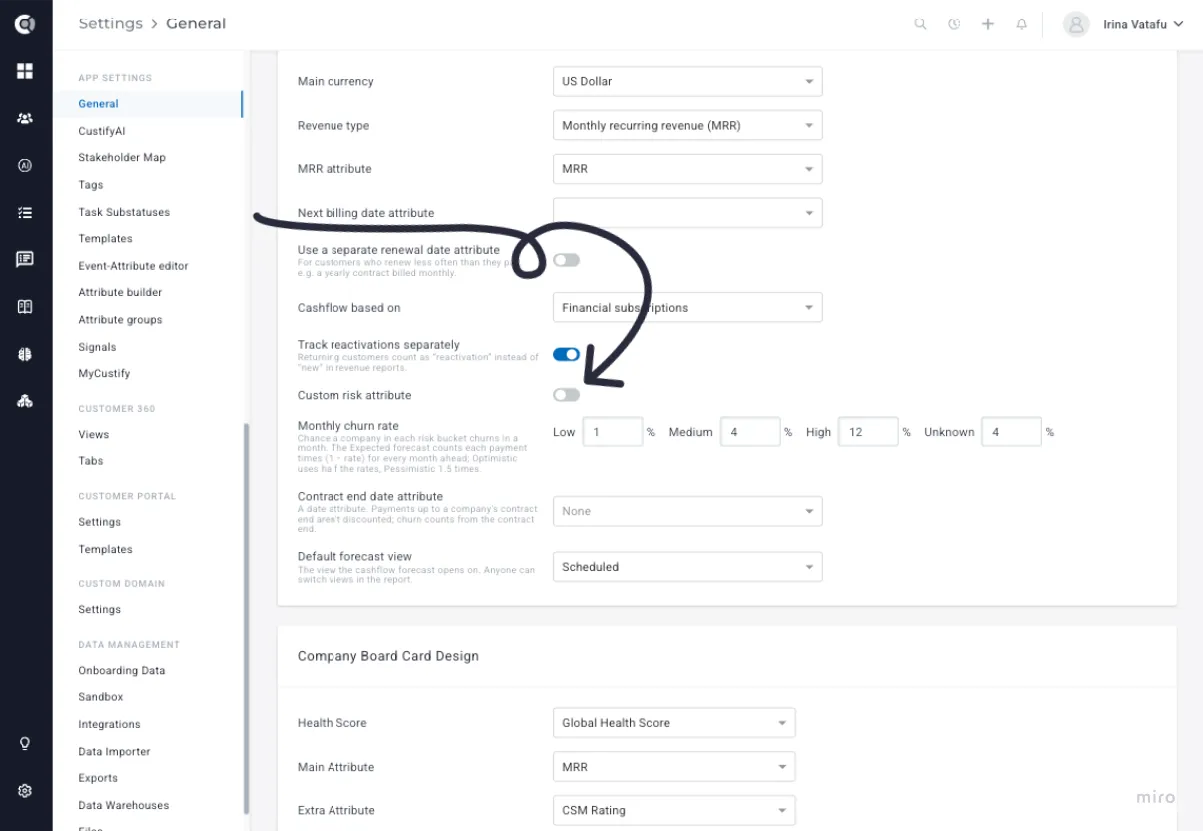
How to use it: go to Settings > General > Cashflow. Choose your risk attribute and map each of its values to Low, Medium, or High, set the monthly churn rate for each level, and optionally choose a contract end date attribute (payments before the contract ends are not discounted). You can also make Expected the default view. Until you change anything, the report opens on Scheduled with the same numbers as before.
A Separate Renewal Date
Customers who renew yearly but pay monthly or quarterly no longer show up as "renewing" before every invoice. You can now use a separate renewal date for MyCustify Renewals, the renewal reports on the revenue dashboard, Customer Evolution and CustifyAI, while the cashflow forecast keeps using the next billing date.
If you use Chargebee, Recurly, Younium, or Maxio Core, a new Renewal date attribute is filled in automatically from your subscriptions’ term end. With other billing systems, you can send your own renewal date attribute through a CSV import or the API.
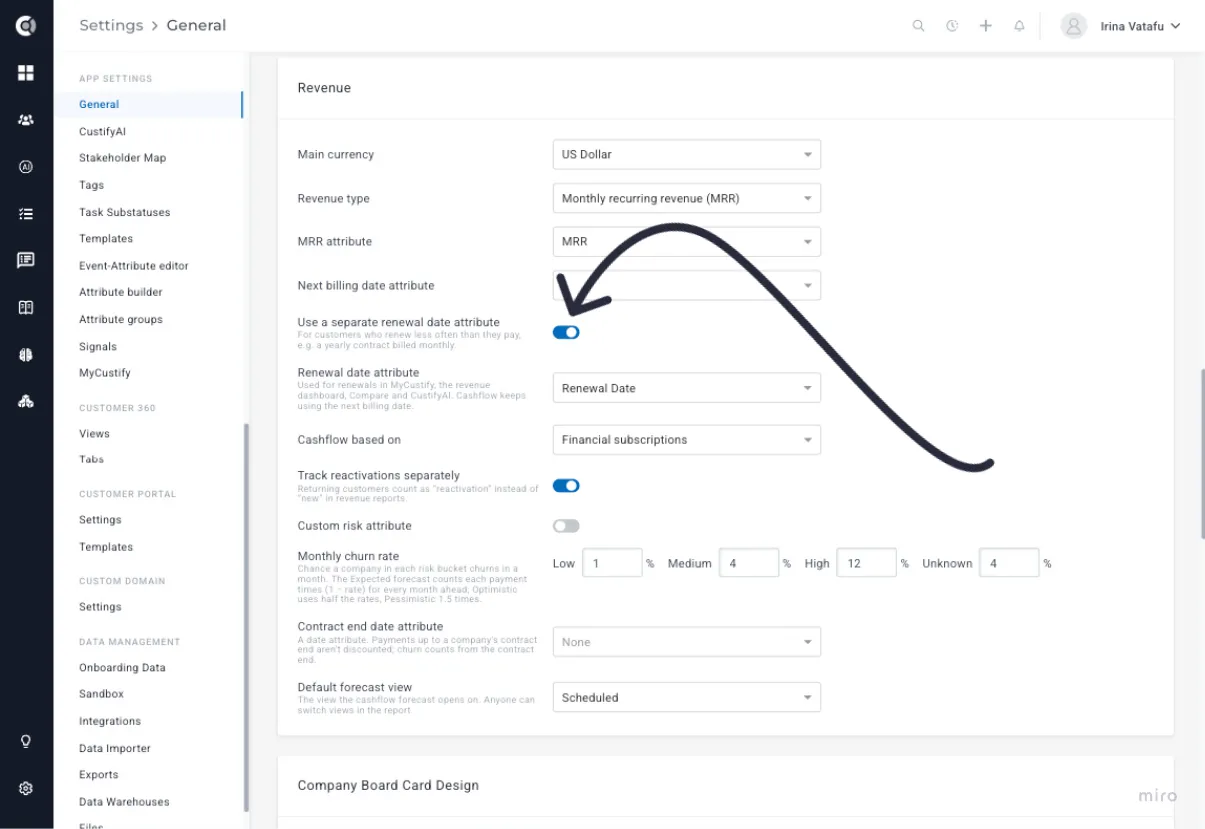
How to use it: go to Settings > General > Revenue, turn on Use a separate renewal date attribute, and select the date attribute to use. Nothing changes until this setting is turned on.
MCP Server Enhancements
If your team uses an AI assistant connected to the Custify MCP server, two everyday tasks now take a single sentence:
Log time from your AI assistant: just say “I spent 2 hours on Acme this week”, and the time entry is created on that customer, exactly like one added in Custify. No forms to fill in and no switching tabs, so your time tracking stays complete without extra effort.
Create calculated metrics from your AI assistant: ask your assistant which calculated metrics you already have, or describe a new one, for example “the number of support tickets opened in the last 30 days”. The assistant builds it for you, and the new metric stays inactive until someone on your team reviews it and turns it on in Custify, so nothing changes in your health scores or reports without your approval.
Other Useful Enhancements
MyCustify
Needs reply
The Communications section is now Needs reply, a list of the customer emails your team still owes an answer to. It shows the latest customer email of each thread from the last 7 days that nobody has replied to yet, with urgent emails first and the AI summary on hover. Any reply counts, including playbook and sequence emails, and emails that don’t need an answer (auto replies, or a simple "thanks!") are left out.
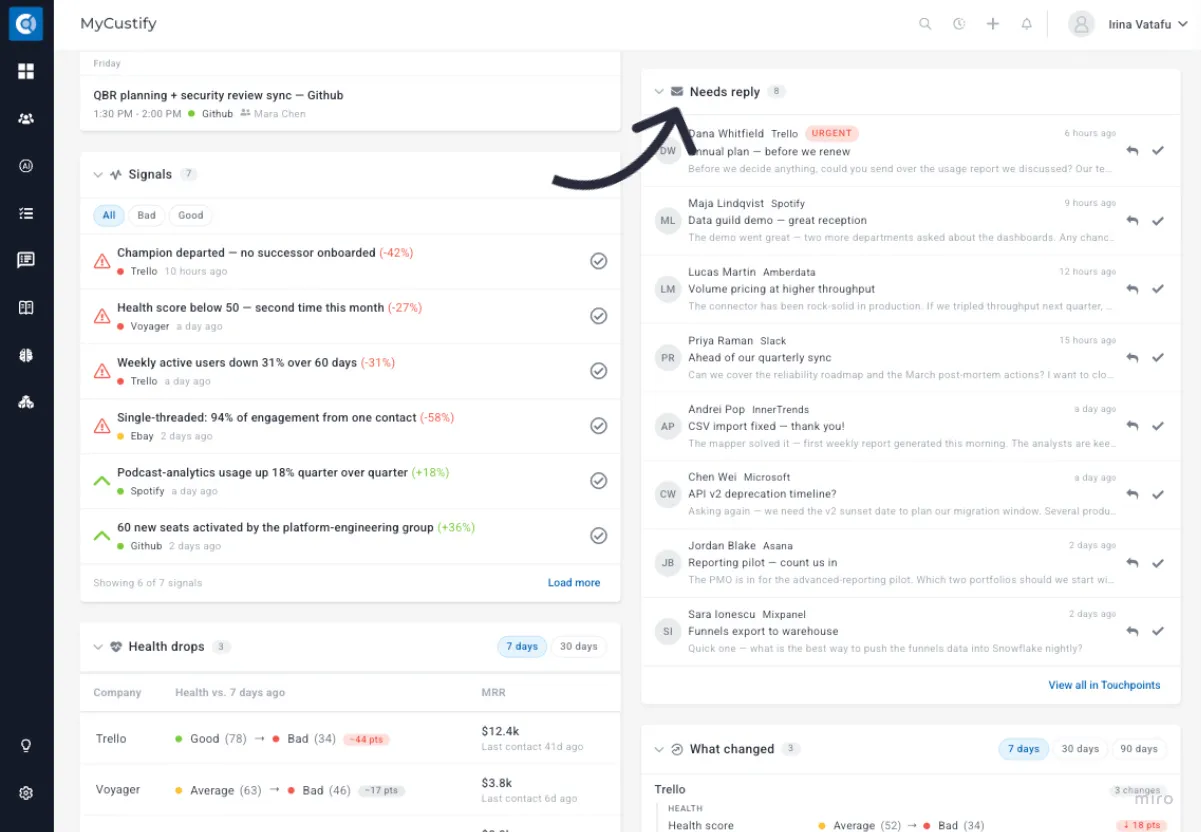
When you reply from MyCustify, the email disappears for the whole team straight away, and you are warned if a teammate already replied. For threads that were handled elsewhere, click No reply needed; you’ll find them under Show handled, with an Undo.
Dismiss an AI insight for the whole team
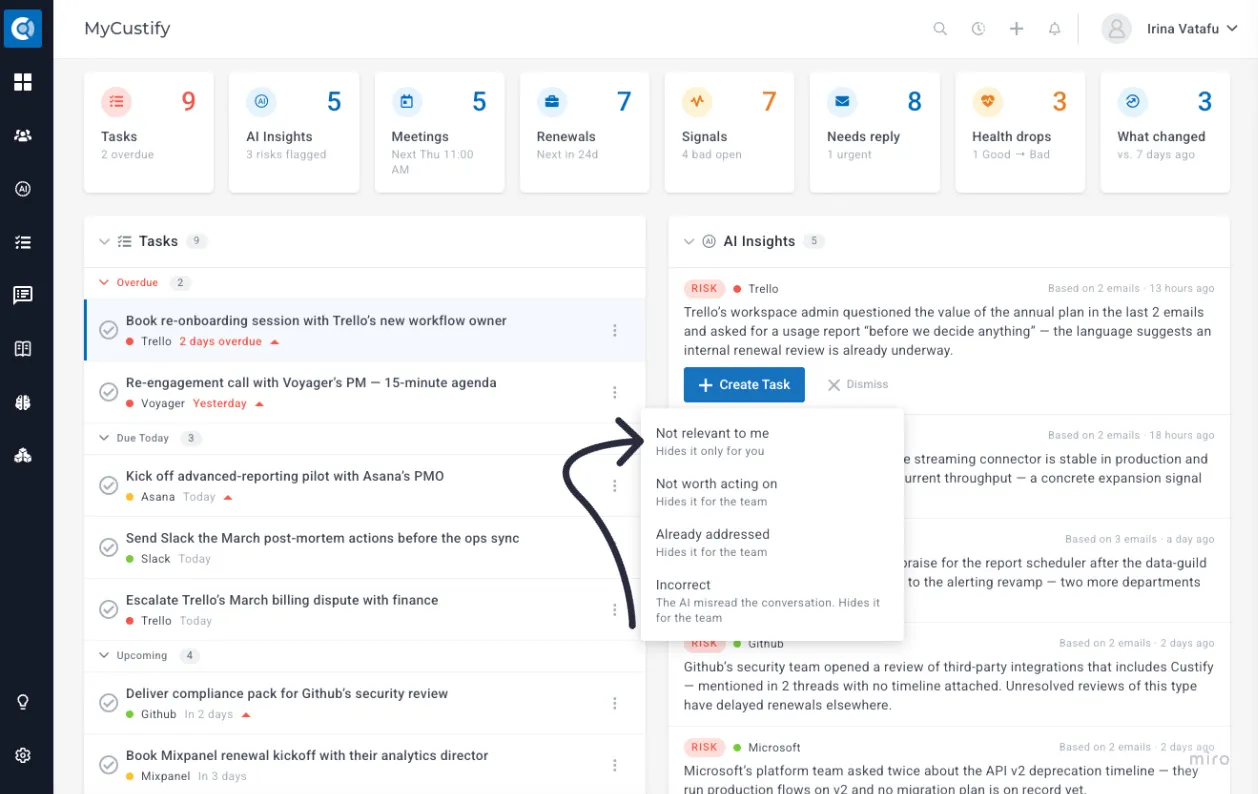
When you dismiss an AI insight, the reason you choose now decides who stops seeing it. Not relevant to me hides it only for you. Not worth acting on, Already addressed and Incorrect hide it for the whole team, and creating a task from the insight closes it for everyone too. Show dismissed lists who dismissed what and why, with a Restore option.
Task details without leaving MyCustify
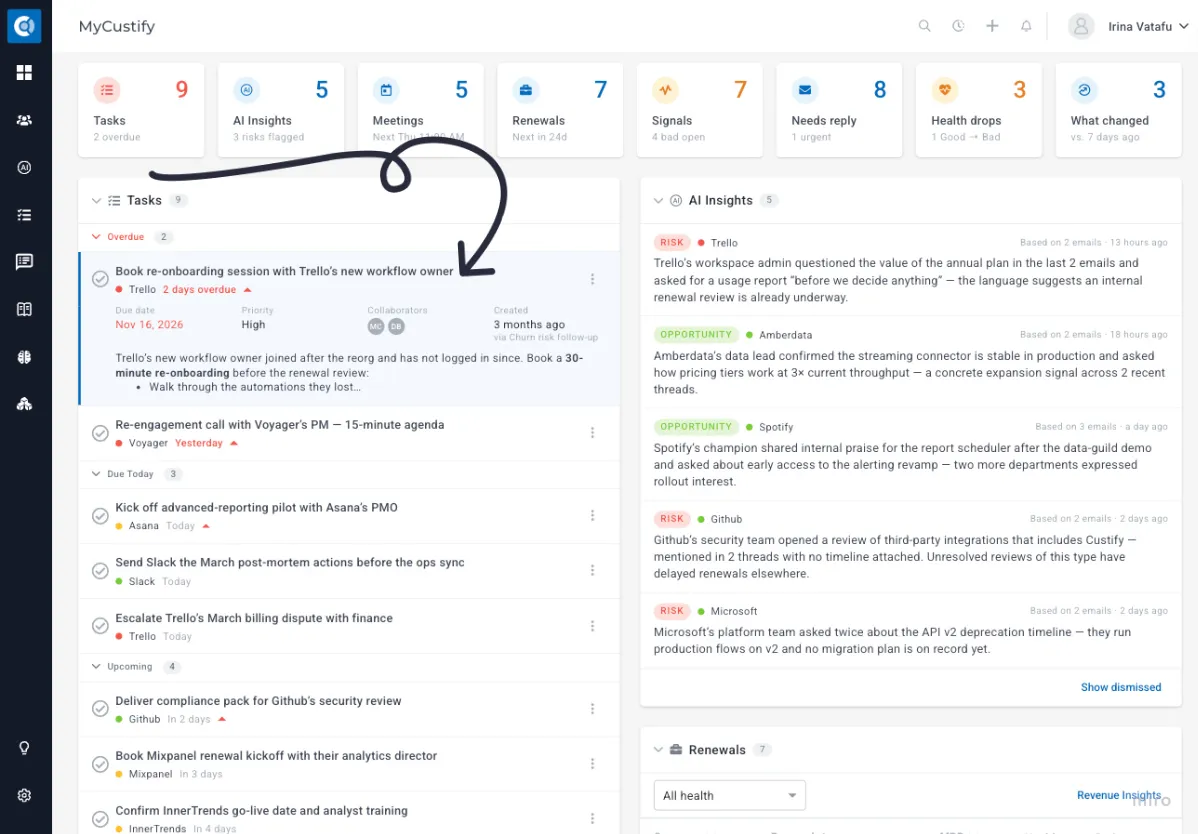
Click any task in the Tasks section to expand it and see its details right in the list: due date, priority, collaborators, when it was created and by which playbook, and the full description. You get the context you need to act without opening the task or the customer profile.
Filter MyCustify by segment
Focus your home page on what matters right now. Switch between My companies and All companies I can see, and narrow every section to one or more segments, for example "Enterprise customers" or the companies in your region. Your choice is remembered.
Default homepage for your account
Admins can now choose where everyone lands after logging in: MyCustify or the Companies list. Go to Settings - General - Default statuses and formatting -Default homepage. Each user can still pick their own homepage in Settings - My account, which always wins over the account default.
Segments
Segment by Lifecycle Goal
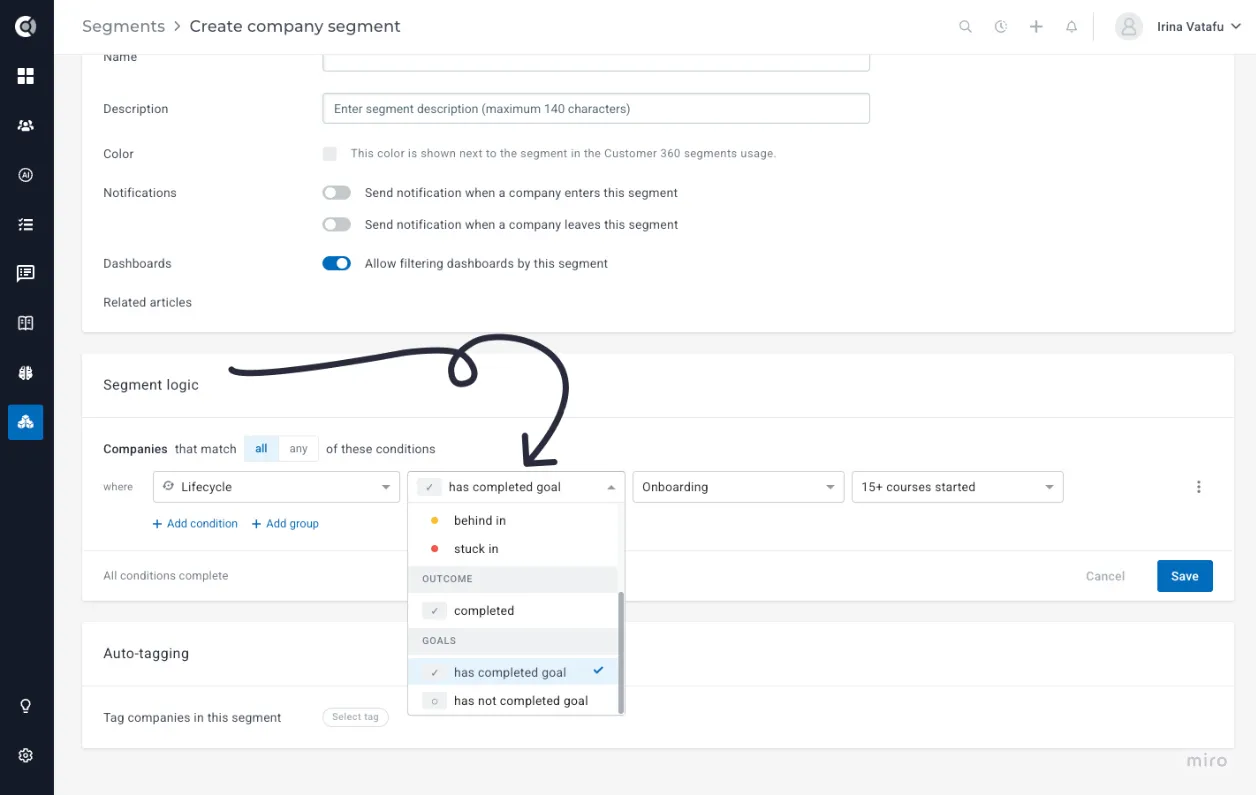
Lifecycles track the journey; now goals can drive what happens next. Segments get two new conditions, has completed goal and has not completed goal, for a chosen lifecycle and goal. A company enters the segment after completing the goal, so completing "Go live" can start the handoff to your CS team, send a Slack alert, or change what the customer sees in the portal. You can combine goals with any other condition, such as tier, plan, or CSM, and the Companies list gets a Lifecycle goal filter too.
Playbooks
Segment digests and spike alerts
Multiple Companies and Multiple People playbooks have a new data set source, Moved into or out of segments: the companies or people that entered or left one or more segments since the playbook last ran, or in the last 1 to 90 days. Tables and files can include a new Segment moves column, for example, "Entered Churn risk (21 Oct)". Two new templates help you start: Weekly segment digest and Segment spike alert, which warns you when, for example, 10 or more companies enter a segment on the same day.
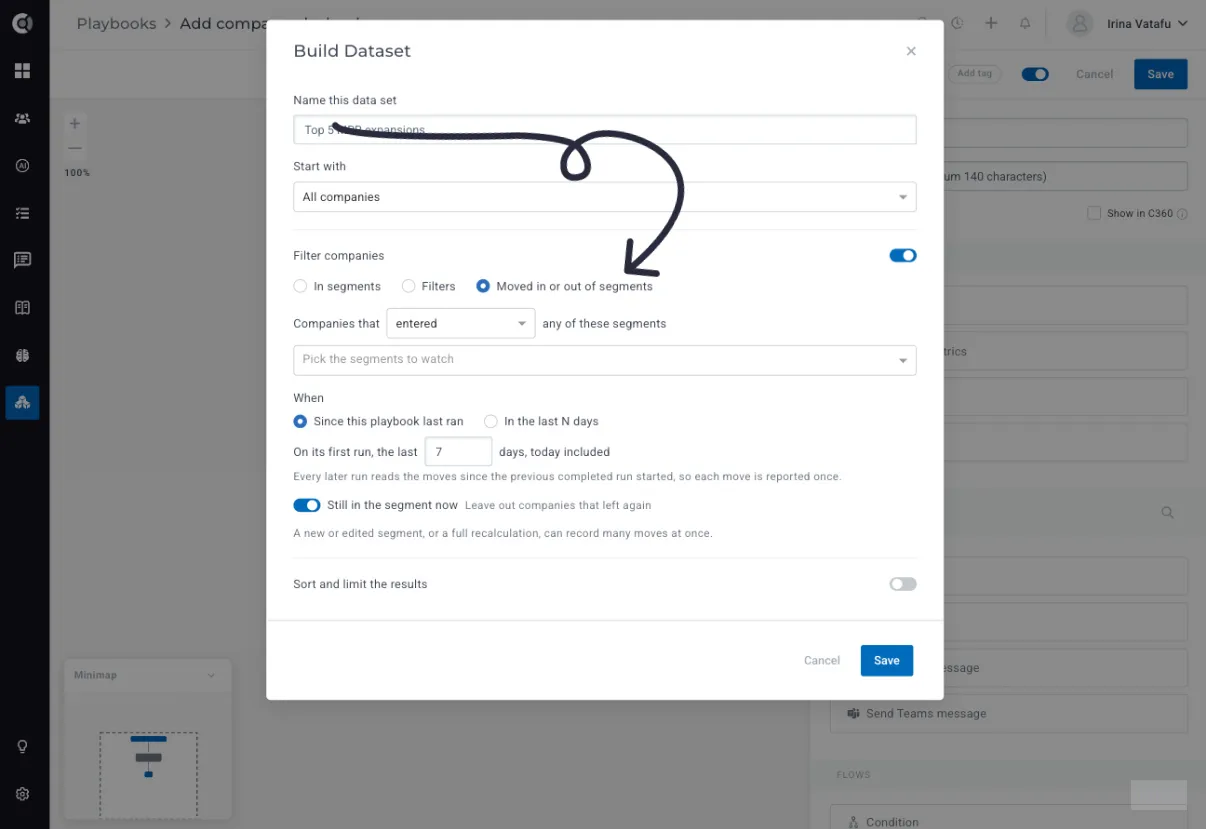
Good to know: a new or edited segment reports all its members as "entered" once.
Custom table style
The Build Table step has a new Custom style: choose header, row and alternate row colours, line colour and width, and grid or horizontal lines, so your digests match your brand. Slack and Teams messages still show the table as a list.
Link performance across all steps
If you send the same email in several versions, for example, one per sender or per language, the same link sits in many steps, and its results are spread over many rows.
The Email Stats tab of a playbook now has a third view next to By step and By link: By link (all steps). Each link appears once, with its totals across every email step that contains it (in how many emails it was sent, how many were clicked, and the click rate), plus the list of steps it is in. You can also sort by any column, including the link itself, in both link views.
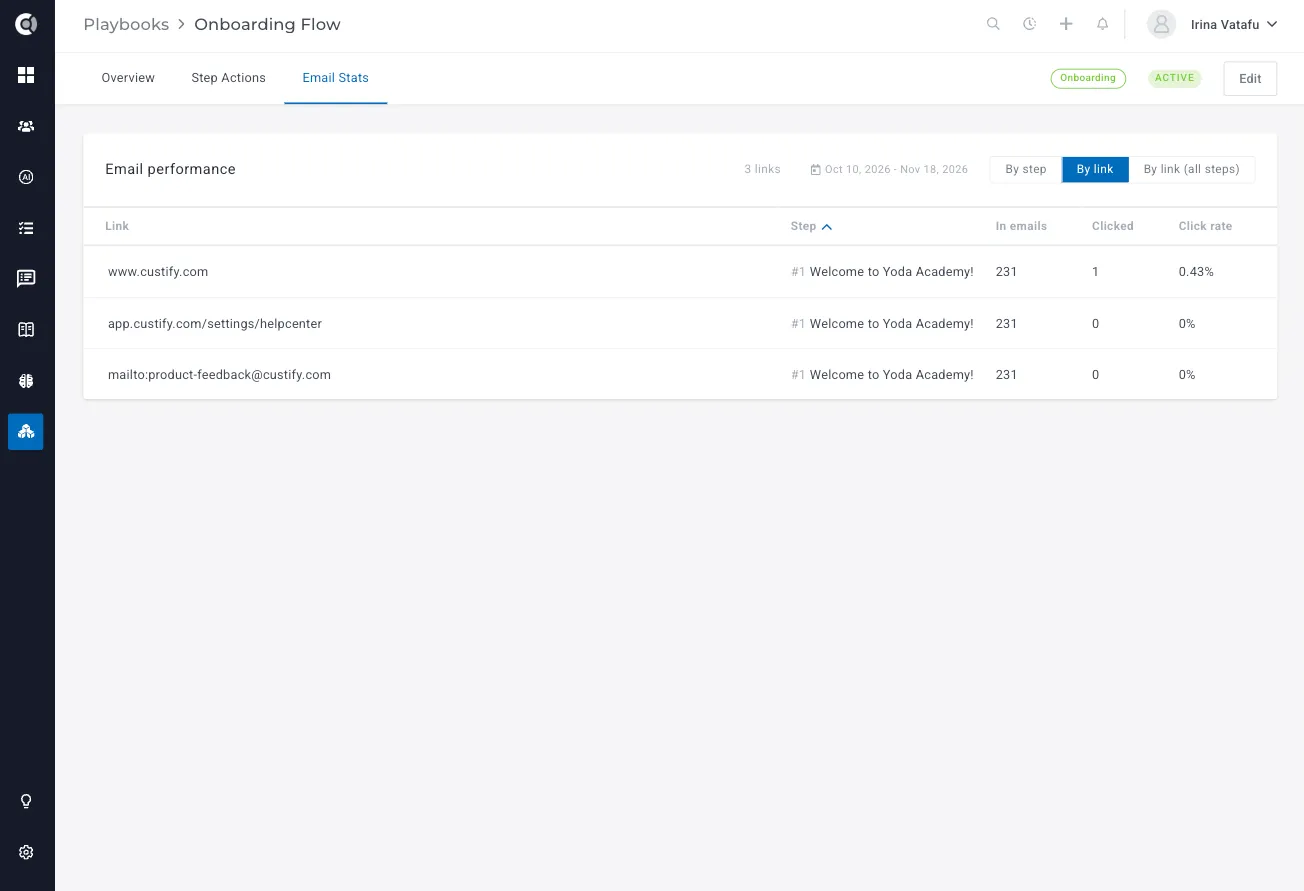
Good to know: links are grouped only when the URL is the same, so the same page with and without tracking parameters stays on separate rows.
Data set filters that match your lists
In Multiple Companies and Multiple People playbooks, the filters of the Build Dataset step now return exactly the same companies or people as the same filter on the Companies and People lists, including Lifecycle, Playbook, Lifecycle goal, and Attribute changes filters. At least one can even combine different kinds of filters, for example "Lifecycle completed" or "Playbook completed".
Good to know: Me (current user) is no longer offered in these filters, because a scheduled playbook runs without anyone looking at it. If one of your data sets used it, pick a named user instead. An Attribute changes filter needs change tracking turned on for that attribute.
Communication and Emails
Leave automated emails out of touchpoints
If your team tracks outreach through Last touchpoint or Last outgoing communication, NPS surveys and playbook emails can make an account look recently contacted when nobody has actually spoken to them.
A new setting, Exclude automated emails (playbook emails and surveys) from touchpoints, leaves them out, while manual emails and emails from your own mailbox count as before. Each Send email and Send survey step can override it with Always count or Never count.
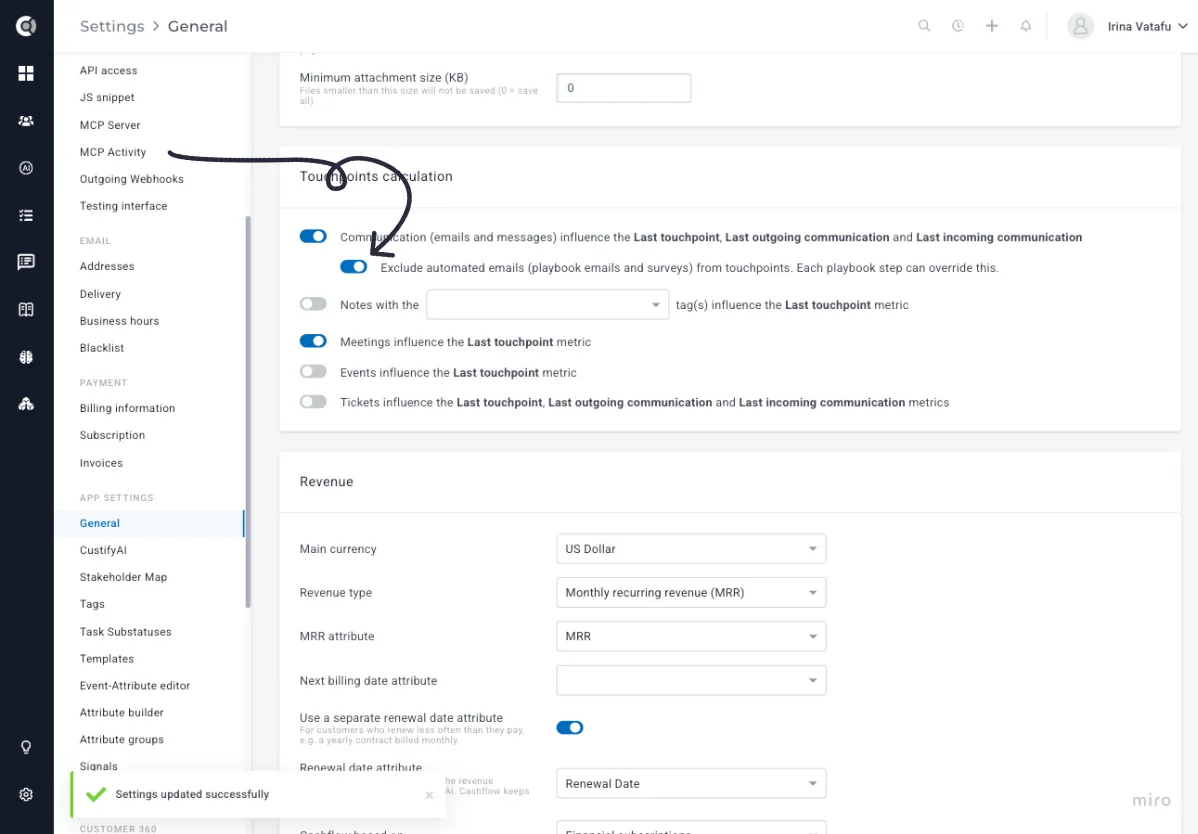
How to use it: go to Settings > General > Touchpoints calculation and turn the setting on under Communication. Existing companies are recalculated in the background. Excluded emails still appear in the company’s conversations.
Email templates in Smart Content
Reuse what your team already wrote. A Smart Content block can now be filled from an email template: choose it under Fill from template, and its content, tables, formatting, and merge tags are copied into the block. This works in the email composer, bulk emails, playbook emails, and Settings - Templates. The subject, CC/BCC, and attachments are not copied, and templates that contain Smart Content or use advanced HTML mode can’t be used.
Customer Portal
Usage blocks in the portal
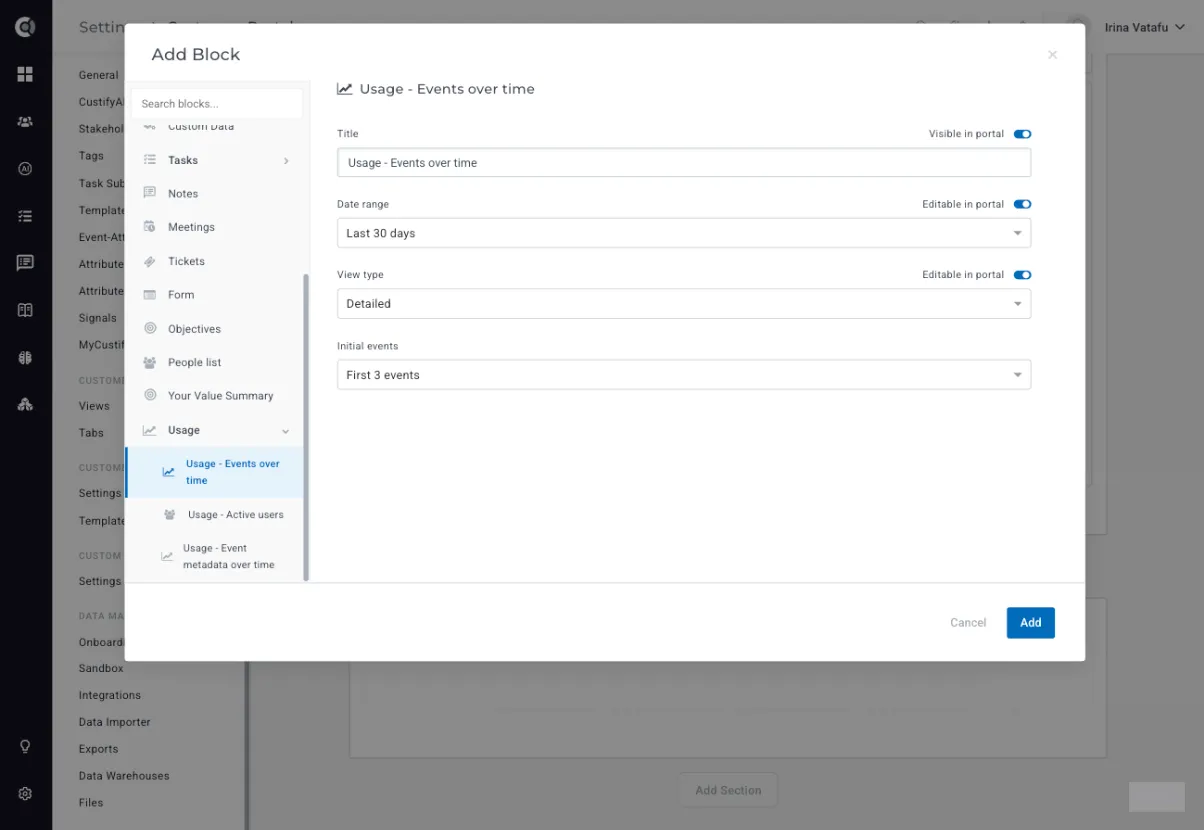
Share adoption with your customers the way your CSMs see it. Usage blocks such as Active users, Usage events over time, and Event metadata over time can now be added to Customer Portal templates.
Task files in the portal
Files attached to a task now appear on that task in the Customer Portal, and customers can download them, as long as the file is marked Show in portal.
Customer 360
Last 90 days on history blocks
Attribute history and Health Score history blocks have a new Last 90 days option, grouped by week, on Customer 360 tabs and in the Customer Portal.
Usage share on the Stakeholders map
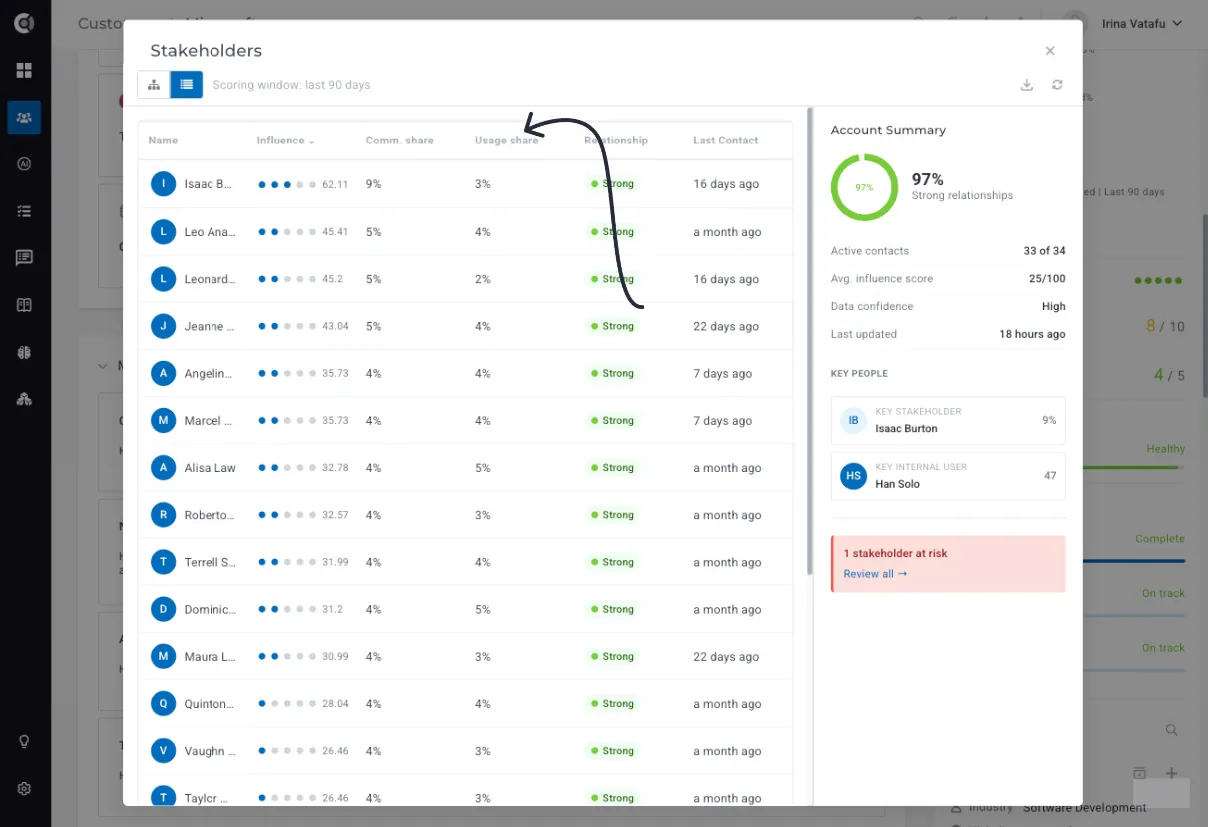
See who actually uses the product, not only who joins the meetings. The Stakeholders map list view and its CSV export have a new sortable Usage share column: each person’s share of the product events generated by the people on the map. The values appear after the next nightly update, or right away if you click Recalculate.
Calculated Metrics
Leave a sender out of message metrics
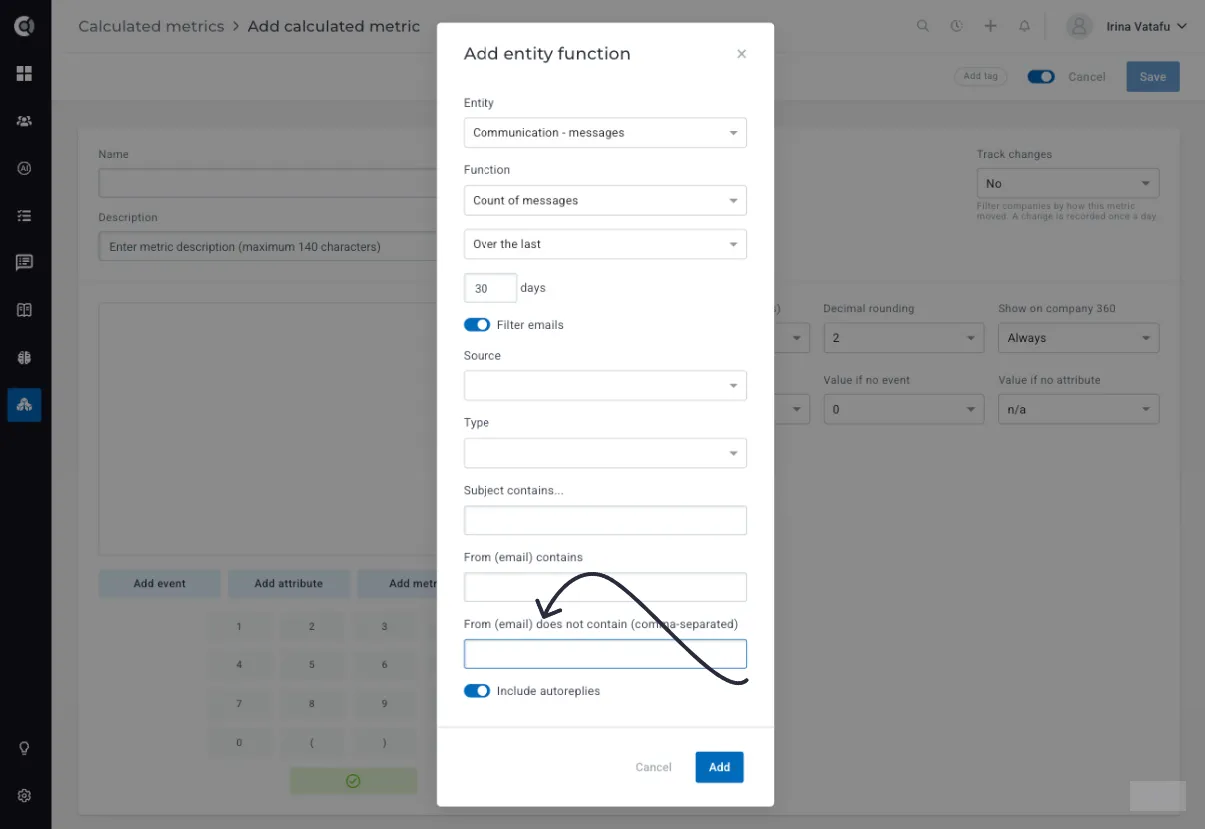
Message metrics have a new From (email) does not contain filter, which takes several comma-separated values. For example, leave billing@ or noreply@ out of "Days since last message", so your health score reflects real conversations with your customers.
Data and Integrations
CSV Imports - A faster importer for large files
Large imports no longer need to be split or left running overnight. You can now import CSV files of up to 200 MB, and follow every import as it runs: upload progress, rows processed with the estimated time left, and a summary of imported and not imported rows. Turn on Email me when it finishes and leave the page; we’ll email you when it’s done.
Failed rows are now grouped by error type, for example, "Invalid date in signed_up_at, 28 rows", with the most common values behind each error, and you can download all errors as a CSV to fix them in bulk. The imports list also lets you download the original file of a past import (kept for 365 days, for users with the Manage app settings permission).
Integration settings history
When a sync starts behaving differently, you can now see what changed. Each integration has a View history link next to its name, showing who changed which settings, when, and from what to what, including Teams channels, Segment filters, and disconnects. Secret values such as API keys are never shown.
General
More colours for tags and usage charts
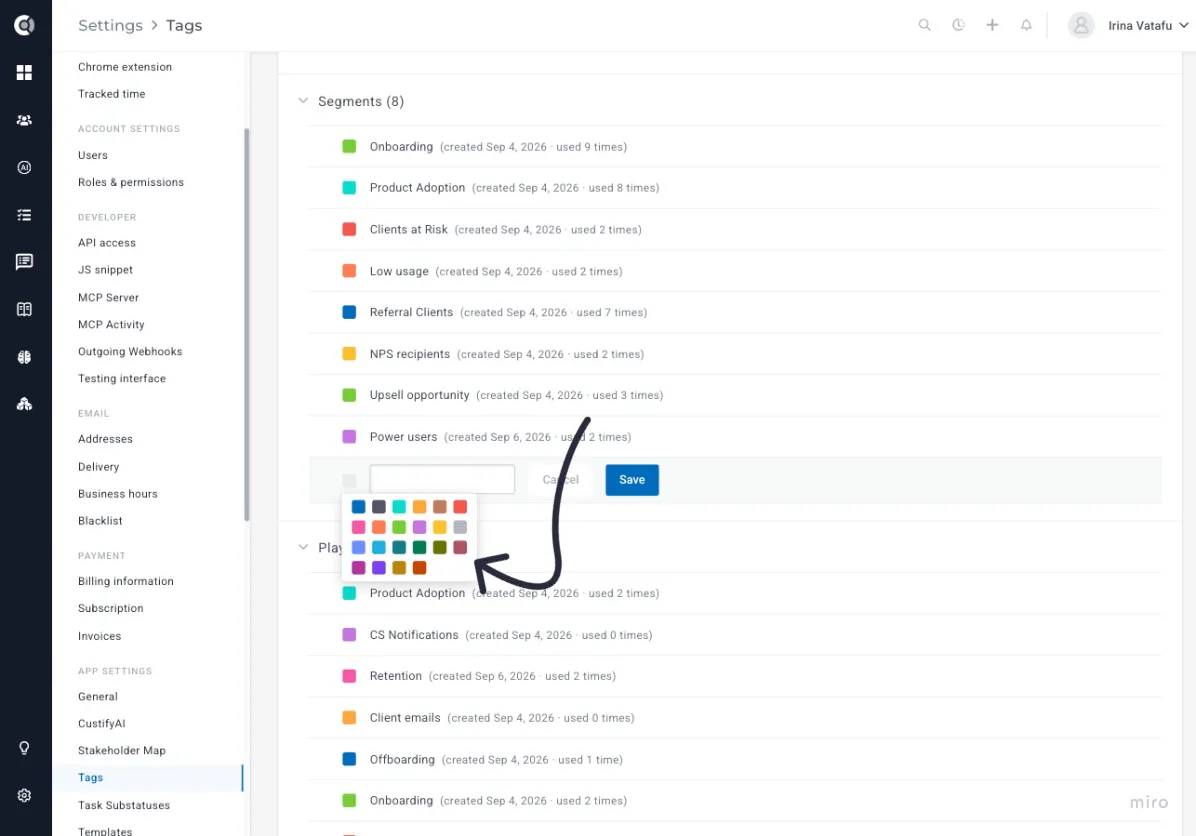
Custify now has a larger colour palette, so tags and the series in usage charts are easier to tell apart. A usage block with many series, on the Customer 360 or in the Customer Portal, no longer repeats a colour up to the 20th series.