How to calculate and report on Active Users?
An excellent gauge of customer health, particularly during the adoption phase, is achieving a high engagement rate among all of a company’s users.
We often encounter situations where a company may exhibit a strong usage rate, primarily because of one or two key users. However, when these key users transition to different roles or depart from the company, it jeopardizes the relationship and raises doubts about the continued necessity of your product.
Hence, monitoring adoption levels across all users becomes crucial. Custify offers three key default metrics to assist you:
- Active users yesterday
- Active users last 7 days
- Active users last 30 days
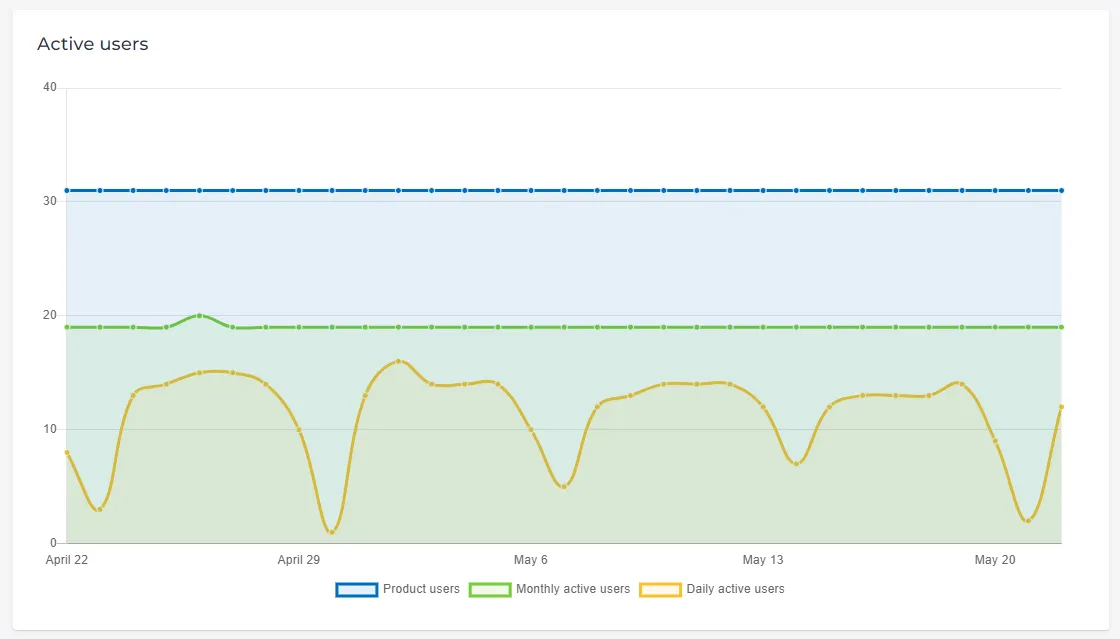
Moreover, when checking the Usage tab of the Company 360 Dashboard, you also get an insightful widget reflecting the number of daily/monthly active users:
You have the flexibility to utilize any of the default metrics to construct a Health Score. However, as we often suggest in our articles, simply comparing raw values may fall short. Comparing the number of active users across your various companies, for example, may not be meaningful due to significant differences in company sizes.
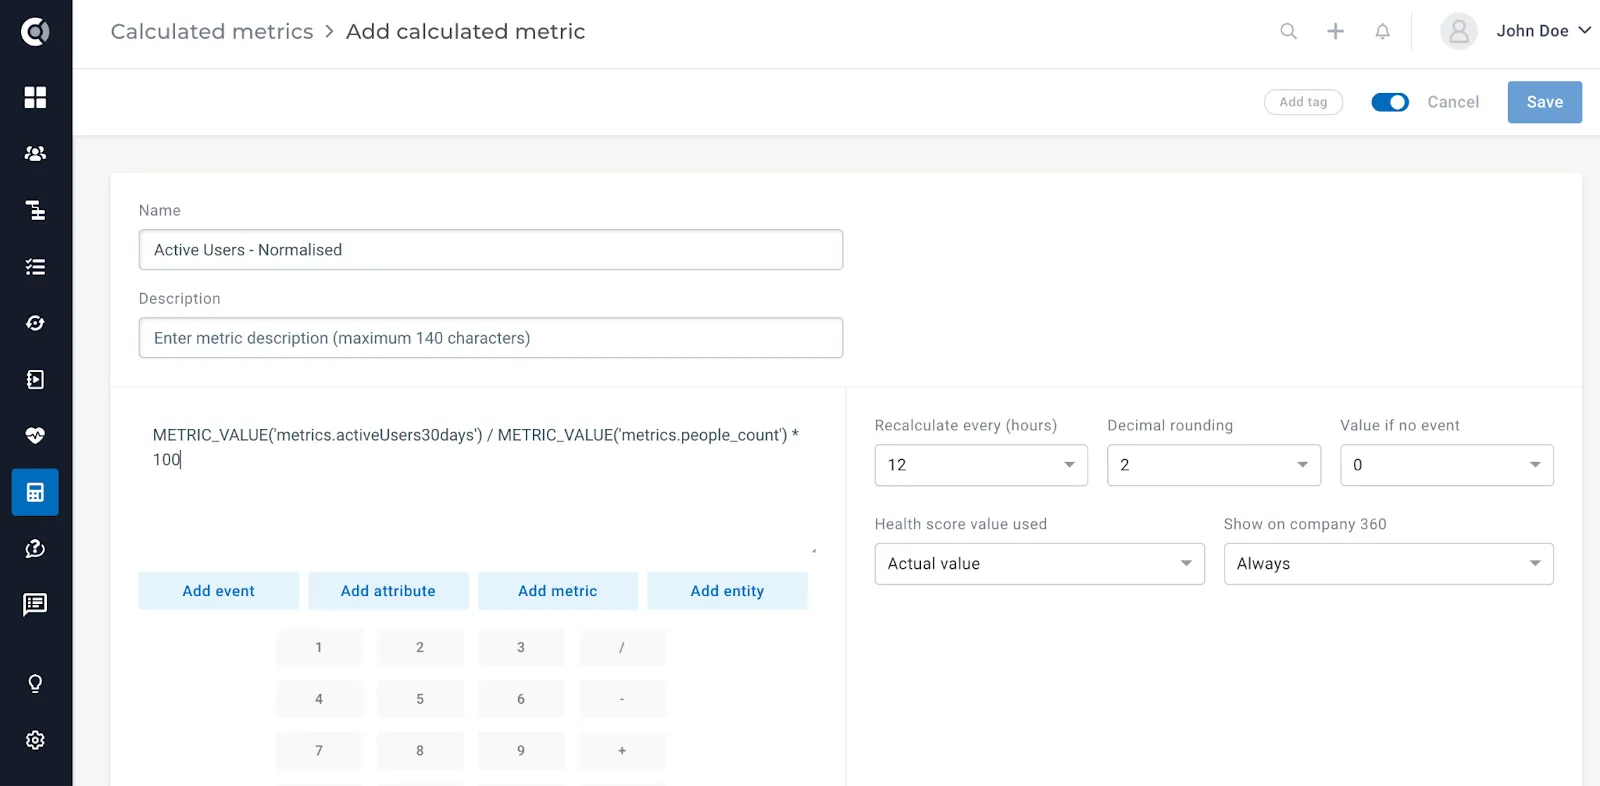
A more effective approach is to calculate the percentage of active users. Using calculated metrics, you can achieve this by dividing the number of active users by the total people count and multiplying the result by 100 to obtain a percentage.
Formula: METRIC_VALUE(‘metrics.activeUsers30days’) / METRIC_VALUE(‘metrics.people_count’) * 100
Situations when Active Users metrics are not populated – and workarounds
It’s important to note that Custify calculates the number of active users based on the events generated by users. There may be situations where you’re not sending people events or not sending events at all. Additionally, there might be cases (though not recommended) where your internal users are also counted as people under a company, potentially inflating the percentage of active users.
In such scenarios, you can create your own calculated metrics as follows.
- Situations where there are no individual user events sent
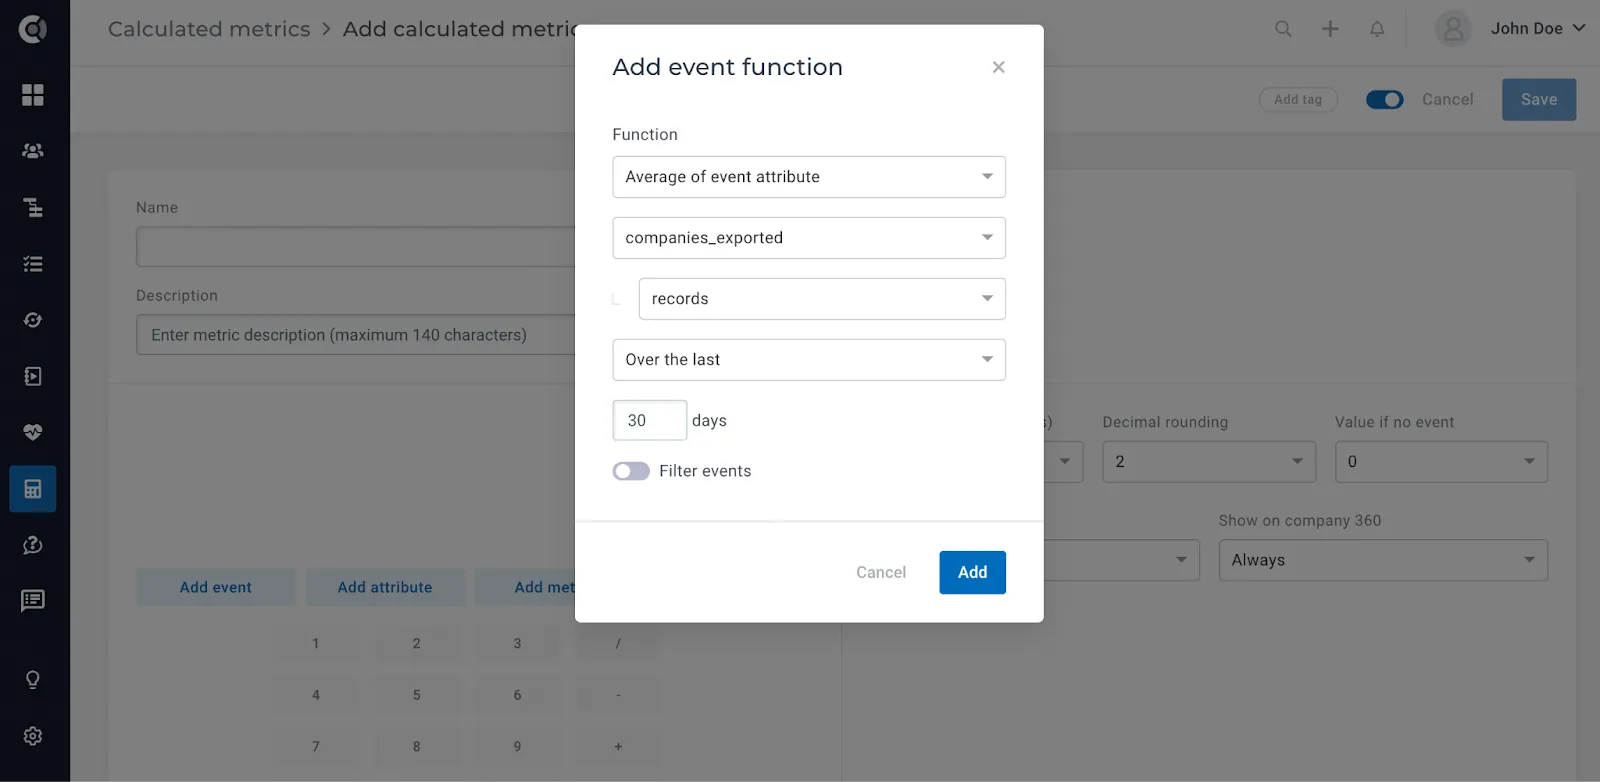
If you have chosen to send only company-level events, it is advisable to include a metadata line that indicates the number of active users from the previous day. You can extract this metadata within the calculated metrics by using the Add event function, such as calculating the average of active users over the last X days.
If that is not possible, you can send a people attribute to track the last time they were active (e.g. Last active date).
Based on this attribute, create a people segment with the condition: Last Active date less than X days ago (e.g. less than 30 days ago).
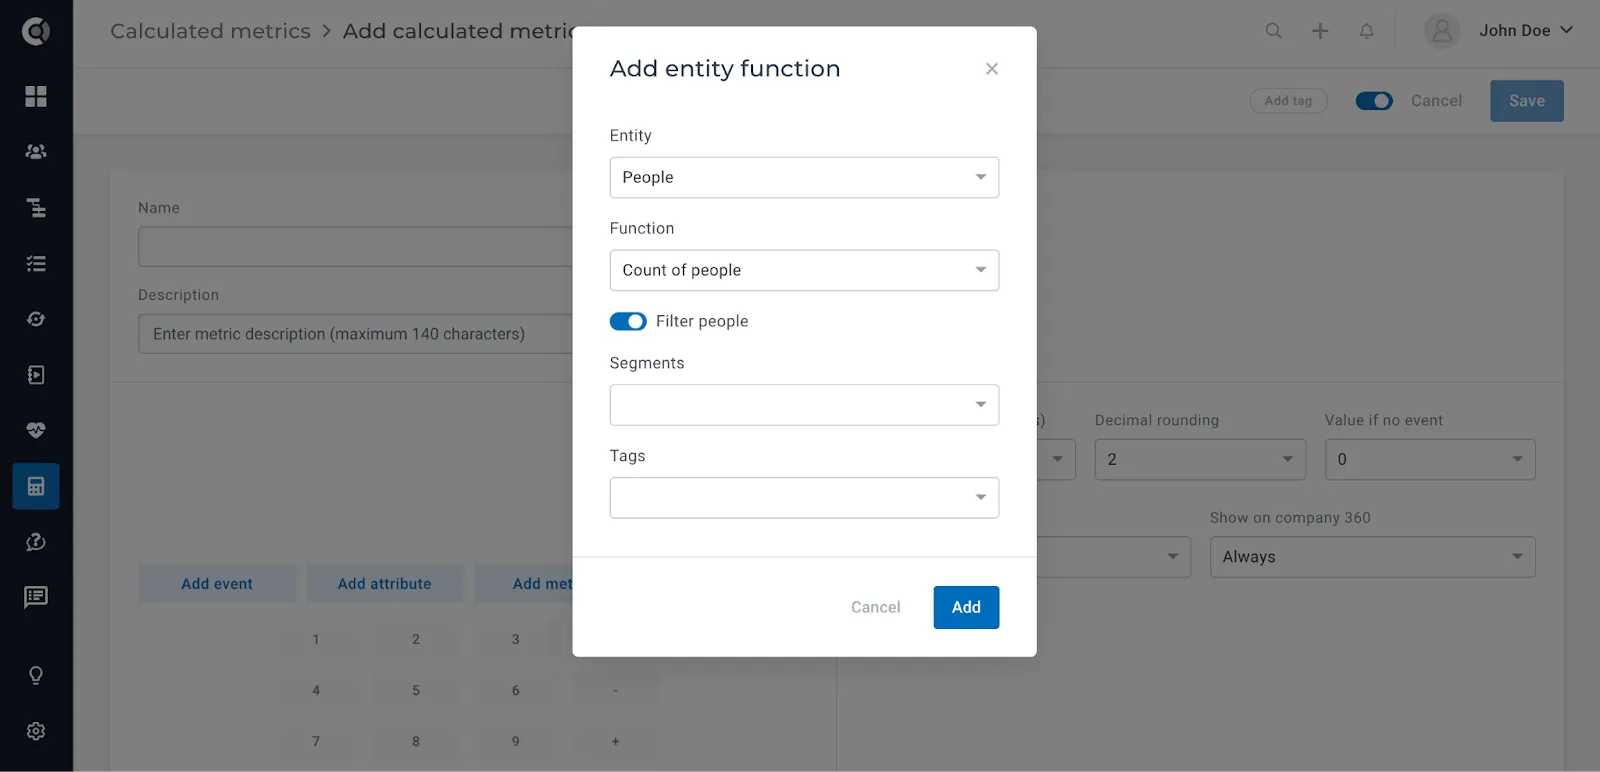
Build a metric that would count the number of people in that segment, by using the Add people function – count the number of people in the segment Active in the last 30 days.
2. Situations when Internal users are impacting the Active users metrics
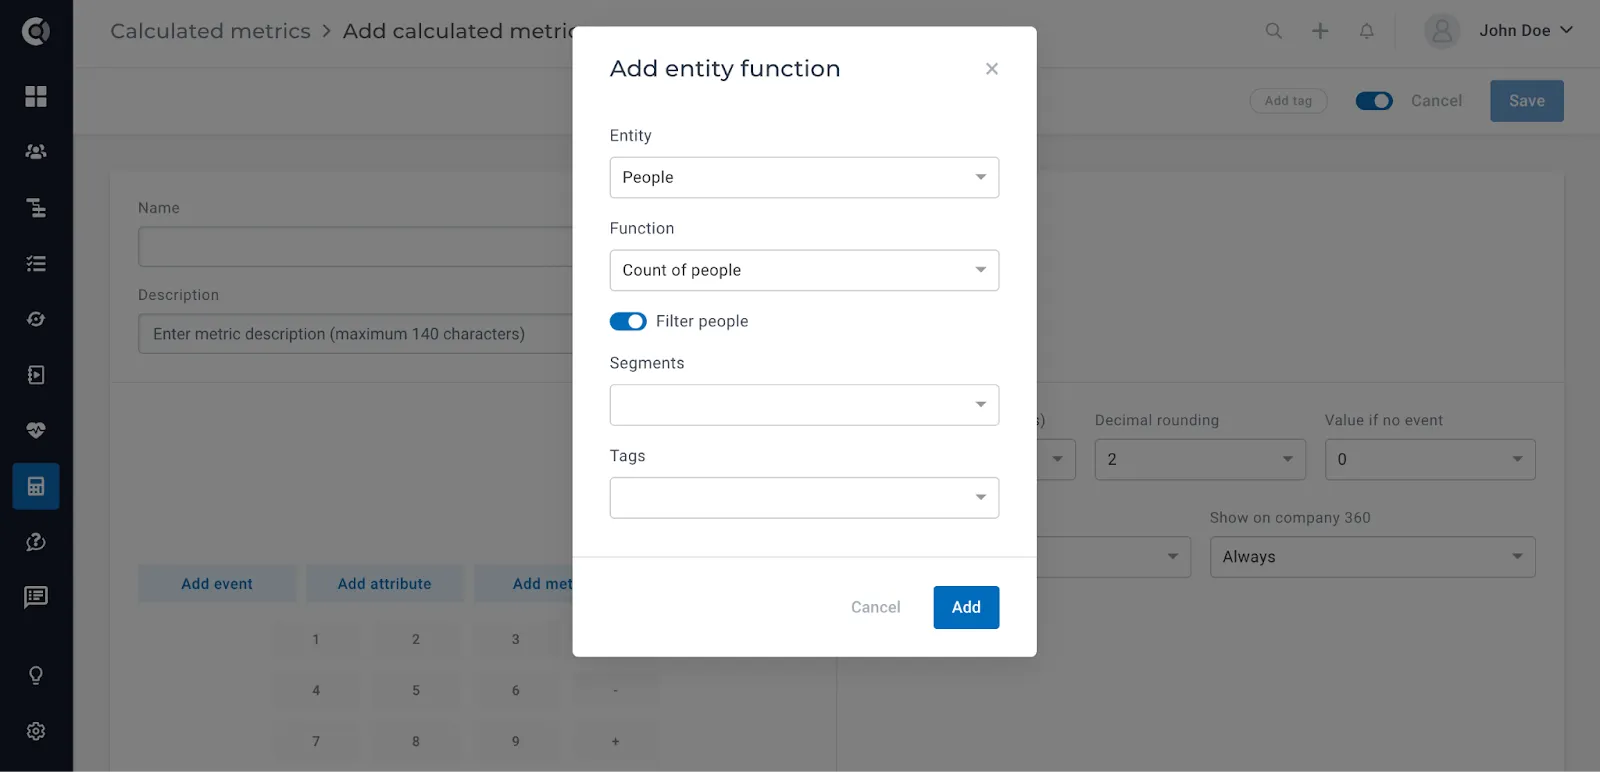
In this scenario, the best way to build your own Active Users metric is to create a people segment that would capture people who generated any events in the last X days AND who do not have an email address with your internal domain.
Example:
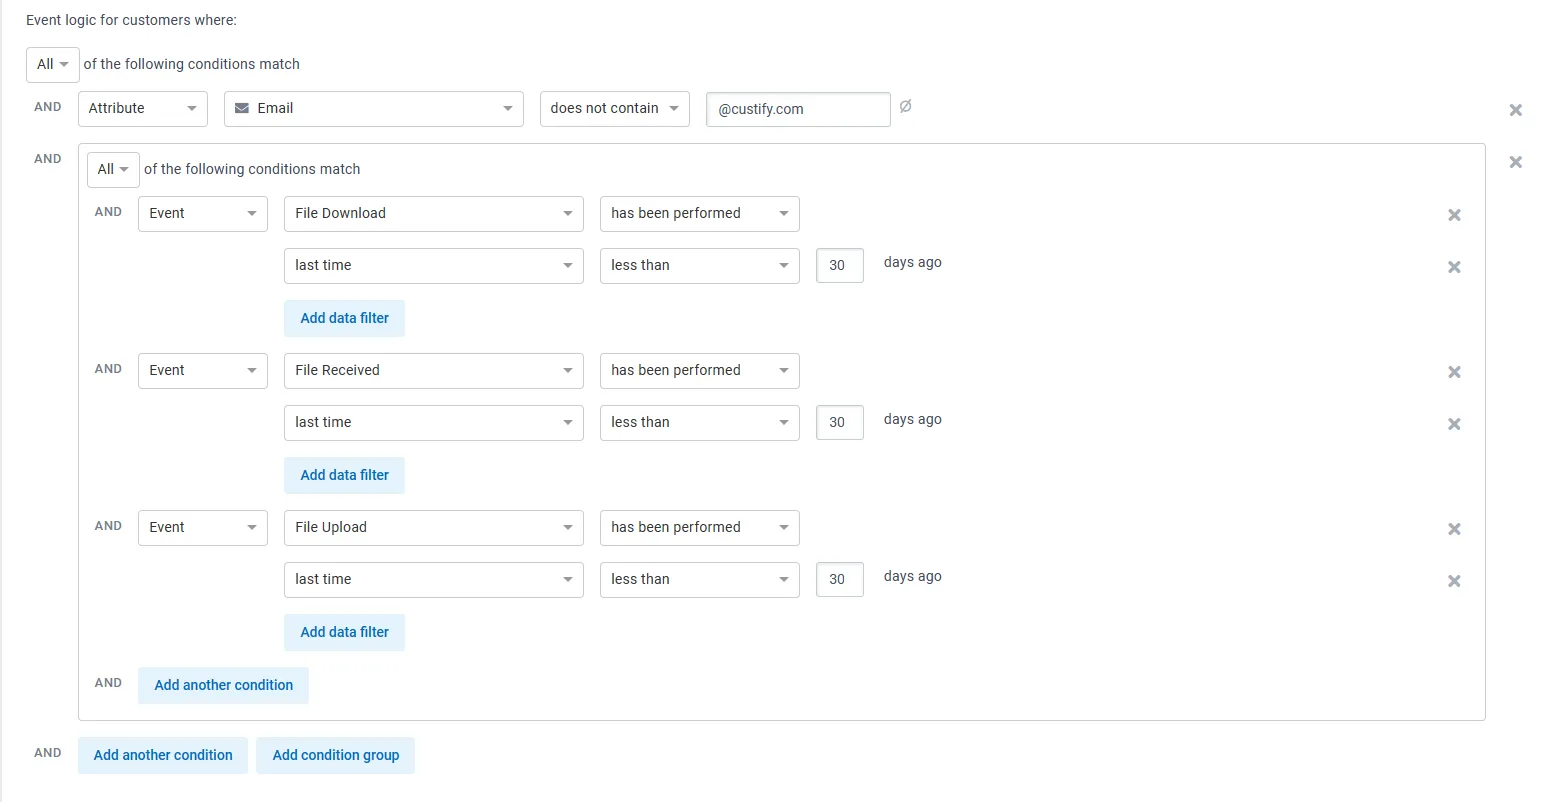
Then create your own metric, by using the Add entity function – count the number of people in the segment Active in the last 30 days (internal users excluded).